
Figures & data
Table 1. Average treatment effect of irrigation: alternative propensity score matching model specifications.
Figure 2. Map of the study location in Northern Ghana.
Source: Authors’ own production.
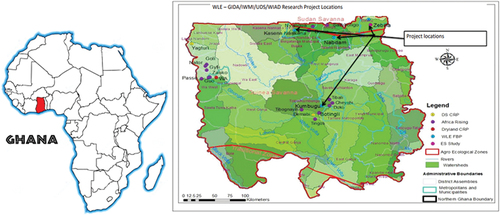
Table 2. Survey sample.
Table 3. Estimation of the logit models on the propensity to irrigate.
Table 4. Overall impact of irrigation.
Table 5. Impacts of different types of irrigation systems.
Table 6. Irrigation impacts by gender/age group.
Supplemental material