Figures & data
Fig. 1: Maps/plans from the VPOR for Vollebekk, Oslo. Left map shows main street network with squares and parks, middle map shows designated land use (yellow: residential, red: school/kindergarten, blue: business), right map shows accepted densities. The VPOR also consists of written descriptions that further elaborate on the criteria for development of Detailed Zoning plans.
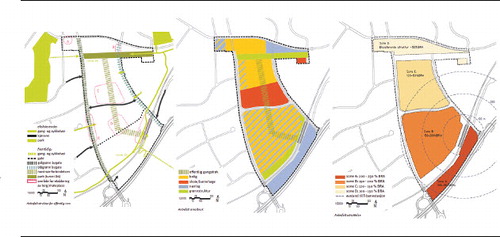
Fig. 2: Location of the four cases in Oslo, Norway. (Source of map: https://od2.pbe.oslo.kommune.no/kart)
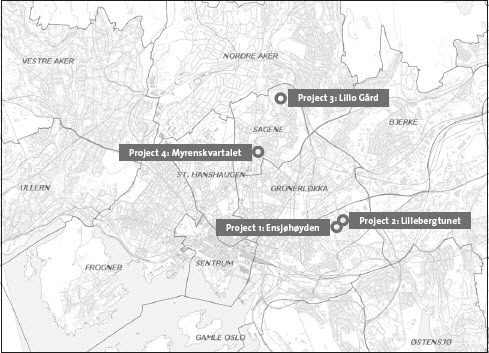
Fig. 3: Project 1: Ensjøhøyden. (Source: http://www.ensjohoyden.no/galleri/)

Fig. 4: Project 2: Lillebergtunet. (Source: https://www.obos.no/privat/ny-bolig/boligprosjekter/oslo/lillebergtunet
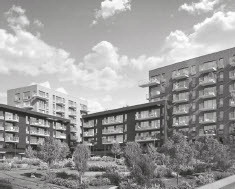
Fig. 5: Project 3: Lillo Gård. (Source: https://lillogard.no/)
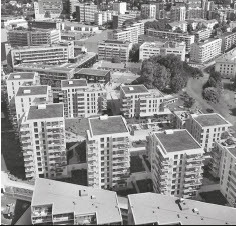
Fig. 6: Project 4: Myrenskvartalet. (Source: http://www.myrenskvartalet.no/galleri/)