
Figures & data
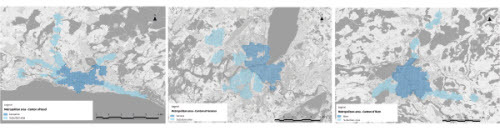
Fig. 1: Metropolitan areas (Geneva, Lausanne and Bern) and sectors for surveying.
Tab. 1: Structure of the working sample by sex, age, education and household composition, in % of respondents.
Tab. 4: Description of the eight modal choice logics in the typology used since 2018.
Tab. 2: Variables included in the ordinal logistic regression model.
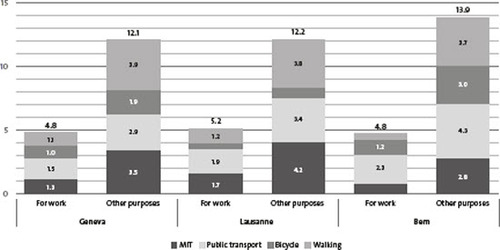
Fig. 2: Average weekly frequency of mode use by purpose and residential context (metropolitan areas), in trip-days (for calculation method: Kaufmann et al. Citation2020).
Tab. 3: Proportion of season ticket holders by residential context (metropolitan areas), in % of respondents.
Tab. 5: Distribution by modal choice logic by residential context (metropolitan areas), in % of respondents.
Tab. 6: Average weekly frequency of use of individual motorised transport by modal choice logic by residential context (metropolitan areas), in trip-days.
Tab.7: Participation in overall MIT traffic by modal choice logic by residential context (metropolitan areas), in % of MIT trip-days.
Tab.8: Ordinal logistic regressionFootnote6 analysis (dependent variable: ordinal frequency of MIT use for commuting).