
Figures & data
Figure 1. Distribution of expected norms by learners in second chance education
Note: Higher values indicate higher universalistic-specific normative expectations
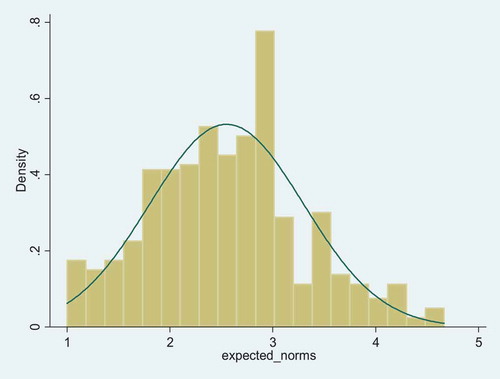
Figure 2. Distribution of the perceived practice of teachers in second chance education
Note: Higher values indicate higher universalistic-specific normative expectations
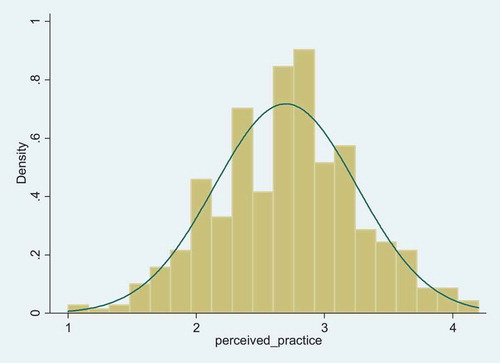
Table 1. Correlations between expected norms, perceived practice of teachers, and individual and family characteristics
Figure 3. Distribution of the differences between experienced teacher practice and normative expectations
Note: Differences smaller than −1 indicate a type A mismatch, differences greater than +1 indicate a type B mismatch
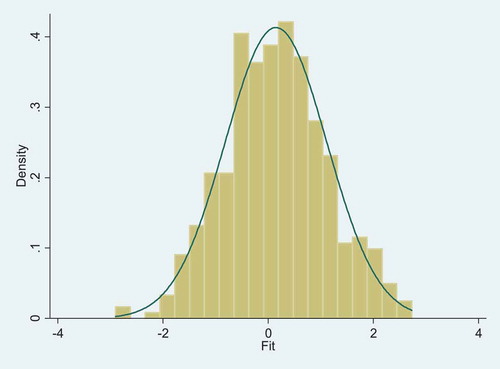
Table 2. Mismatch of fit and individual and family characteristics (all variables standardised; MW)
Figure 4. School engagement, absences and mismatch of fit
Note: Positive values of school engagement indicate a higher level of school engagement. One-way ANOVA (F(2,407) = 12.83, p =.000). Positive values of absences indicate more absences. One-way ANOVA (F(2,407) = 6.84, p =.0012).
Table 3. Regression of school engagement and absence on mismatch of fit, individual and family characteristics (all discrete variables standardised)