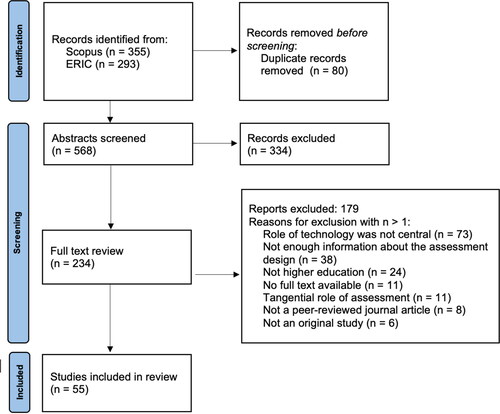
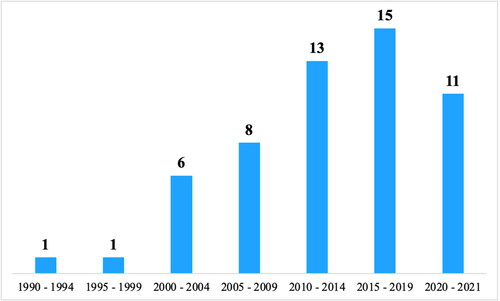
9,769
Views
16
CrossRef citations to date
0
Altmetric
Research Articles

Designing the digital in authentic assessment: is it fit for purpose?

ORCID Icon, ORCID Icon & ORCID Icon

Figures & data

Figure 1. The PRISMA diagram.

Figure 1. The PRISMA diagram.

Table 1. Inclusion and exclusion criteria.

Figure 2. The number of studies published in 5-year intervals. The last interval only represents the timescale from 2020 to August 2021.

Figure 2. The number of studies published in 5-year intervals. The last interval only represents the timescale from 2020 to August 2021.