
Figures & data
Figure 1. Conceptual model.
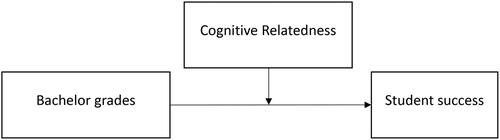
Table 1. Regression results for Models 1 to 12. For Models 1 to 3, we report the McFadden R2. For Models 4 to 12, we report the adjusted R2.
Figure 2. Plot of correlations between master and bachelor grades for groups with low and high cognitive relatedness.
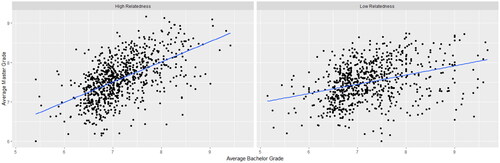
Table 2. Regression results for additional interaction effects.