
Figures & data
Table 1. Keywords and search field.
Table 2. Inclusion and exclusion criteria.
Figure 1. Flow diagram showing study selection process.
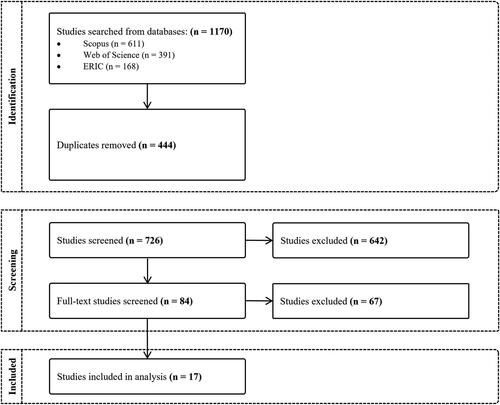
Table 3. Fields extracted from the included studies.
Figure 2. The number of included publications by year.
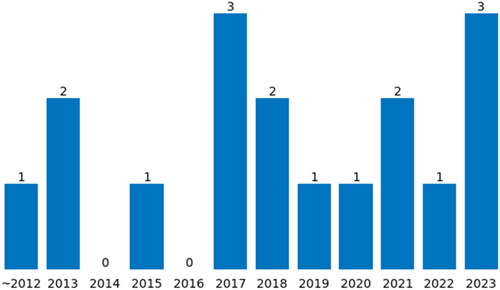
Figure 3. The distribution of included publications by feedback mode.
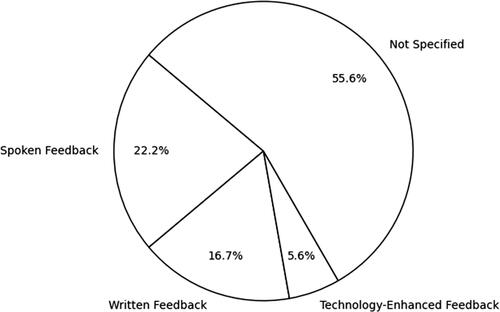
Table 4. Characteristics of relational feedback.