
Figures & data
Figure 1. PRISMA-ScR flow chart outlining record identification and study selection (Page et al. Citation2021).
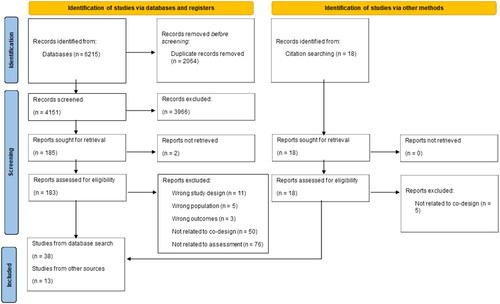
Figure 2. Student learning outcomes as a result of assessment co-design.
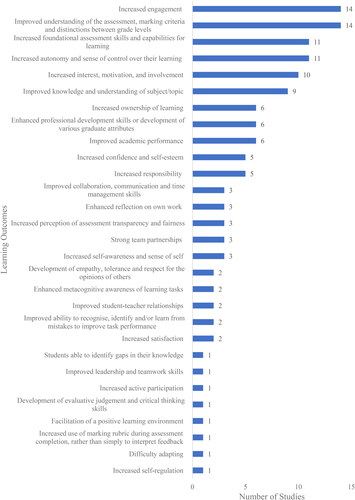
Figure 3. Enablers to effective assessment co-design.
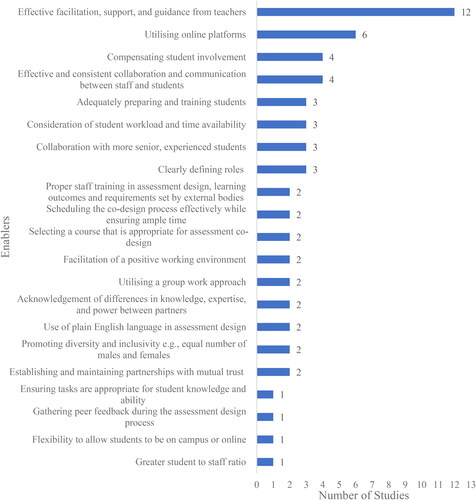
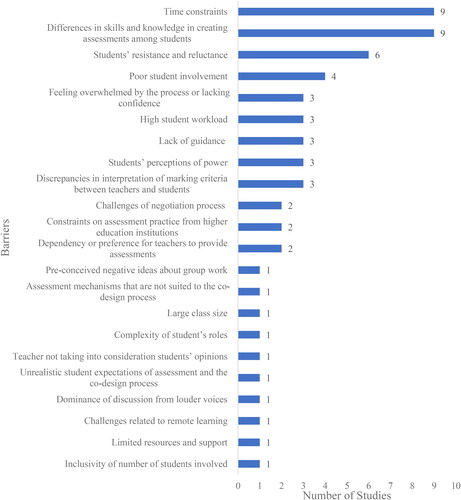
Figure 4. Barriers to effective assessment co-design.
Supplemental material