
Figures & data
Figure 1 Structures of AuAg[MTP(R)]2 (A) and AuCu[MTP(R)]2 (B) models (R = Ph or H) and the Pt2(PCP)2 model (C).
![Figure 1 Structures of AuAg[MTP(R)]2 (A) and AuCu[MTP(R)]2 (B) models (R = Ph or H) and the Pt2(PCP)2 model (C).](/cms/asset/306280cb-5800-4d89-beba-0111c43e5d4c/gcic_a_1467315_f0001_b.gif)
Table 1 Selected bond lengths (Å) and angles (°) for the coordination geometry in the Ag2[MTP(Ph)]2 and Au2[MTP(Ph)]2 complexes
Figure 2 Calculated geometry of the Cu2[MTP(Ph)]2 complex with the C-Cu-S angles (°) shown.
![Figure 2 Calculated geometry of the Cu2[MTP(Ph)]2 complex with the C-Cu-S angles (°) shown.](/cms/asset/eb863193-7b54-4b78-9154-c130d55abdca/gcic_a_1467315_f0002_oc.jpg)
Figure 3 Molecular orbital contours of the Au2[MTP(Ph)]2 complex (isodensity = 0.03 a.u.). Orbital notation is given to describe relative energy (e.g., HOMO–6 = the orbital that lies sixth below the highest occupied molecular orbital).
![Figure 3 Molecular orbital contours of the Au2[MTP(Ph)]2 complex (isodensity = 0.03 a.u.). Orbital notation is given to describe relative energy (e.g., HOMO–6 = the orbital that lies sixth below the highest occupied molecular orbital).](/cms/asset/45977e14-ef9f-43e6-ae50-2793689ae7f8/gcic_a_1467315_f0003_oc.jpg)
Table 2 Kohn-Sham orbital contribution analysis for [Au(MTP(H))]2
Table 3 Kohn-Sham orbital analysis for [Ag(MTP(H))]2
Table 4 Kohn-Sham orbital analysis for [Cu(MTP(H))]2
Table 5 Atomic energy level splitting for Au(I), Ag(I), and Cu(I) reported in cm−1 units for the singlet and triplet excited states, including the weighted average of the spin-orbit microstates of the latter
Table 6 Natural bond order orbital (NBO) analysis for M2[MTP(H)]2 complexes
Figure 4 Molecular orbital contours of the Ag2[MTP(H)]2 complex (isodensity = 0.03 a.u.).
![Figure 4 Molecular orbital contours of the Ag2[MTP(H)]2 complex (isodensity = 0.03 a.u.).](/cms/asset/b06b7ab8-e0db-400e-ac4a-7e3db9149b19/gcic_a_1467315_f0004_oc.jpg)
Figure 5 Molecular orbital contours of the Cu2[MTP(H)]2 complex (isodensity = 0.03 a.u.).
![Figure 5 Molecular orbital contours of the Cu2[MTP(H)]2 complex (isodensity = 0.03 a.u.).](/cms/asset/4583e3a3-6359-4a2b-ada9-e0389a7ba4b4/gcic_a_1467315_f0005_oc.jpg)
Figure 6 Selected total density contours for the Au2[MTP(Ph)]2 complex (isodensity value labeled in each as “Isovalue” in a.u. units).
![Figure 6 Selected total density contours for the Au2[MTP(Ph)]2 complex (isodensity value labeled in each as “Isovalue” in a.u. units).](/cms/asset/75880b8d-e92c-4af0-89cd-2aef74e7b6d8/gcic_a_1467315_f0006_oc.jpg)
Table 7 Selected bond lengths (Å) and angles (°) for Au2 complexes at M06/CEP-31g(d)
Table 8 Natural bond order analysis for MM[MTP(Ph)]2
Figure 7 Illustration of the donor-acceptor interaction in Au2[MTP(H)]2 by superimposing the Au 5d orbital with the Au’ 6p orbital from NBO population analysis (isodensity = 0.03 a.u.).
![Figure 7 Illustration of the donor-acceptor interaction in Au2[MTP(H)]2 by superimposing the Au 5d orbital with the Au’ 6p orbital from NBO population analysis (isodensity = 0.03 a.u.).](/cms/asset/e3875fcb-dd34-4d5c-884f-be025876e913/gcic_a_1467315_f0007_oc.jpg)
Figure 8 Molecular orbital contours of the Pt2(PCP)2 model (isodensity = 0.03 a.u.).
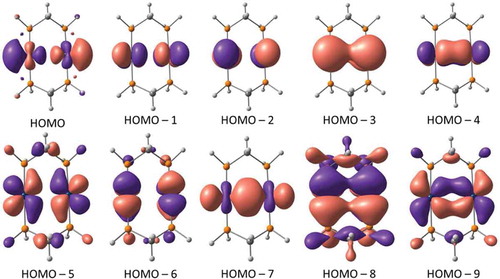
Table 9 Selected bond lengths (Å) and angles (°) for AuAg[MTP(R)]2
Table 10 Selected bond lengths (Å) and angles (°) for AuCu[MTP(R)]2
Figure 9 Calculated geometry of AuCu[MTP(Ph)]2 complex with the C-Cu-S angles (°) shown.
![Figure 9 Calculated geometry of AuCu[MTP(Ph)]2 complex with the C-Cu-S angles (°) shown.](/cms/asset/65a84cf2-df08-409a-81cb-0e6d2db586e8/gcic_a_1467315_f0009_oc.jpg)
Figure 10 Calculated geometry of AuCu[MTP(Ph)]2 complex with the C-Cu-S angles (°) shown.
![Figure 10 Calculated geometry of AuCu[MTP(Ph)]2 complex with the C-Cu-S angles (°) shown.](/cms/asset/0fe69a30-01d4-4aba-ad7d-55dca8509cb6/gcic_a_1467315_f0010_oc.jpg)
Figure 11 Selected Hartree-Fock molecular orbital contours of [AuAg(MTP)2] from MP2 calculations (isodensity = 0.03 a.u.).
![Figure 11 Selected Hartree-Fock molecular orbital contours of [AuAg(MTP)2] from MP2 calculations (isodensity = 0.03 a.u.).](/cms/asset/eb9db5ba-a9e8-4018-b293-466e1388634a/gcic_a_1467315_f0011_oc.jpg)
Figure 12 Total density contours for Au2[MTP(H)]2, AuAg[MTP(H)]2, and Ag2[MTP(H)]2 (isodensity value labeled in each as “Isovalue” in a.u. units).
![Figure 12 Total density contours for Au2[MTP(H)]2, AuAg[MTP(H)]2, and Ag2[MTP(H)]2 (isodensity value labeled in each as “Isovalue” in a.u. units).](/cms/asset/323dce8b-2cd3-436b-b0af-fb8372730dd7/gcic_a_1467315_f0012_oc.jpg)
Figure 13 Selected Hartree-Fock molecular orbital contours of AuCu[MTP(H)]2 from MP2 calculations (isodensity = 0.03 a.u.).
![Figure 13 Selected Hartree-Fock molecular orbital contours of AuCu[MTP(H)]2 from MP2 calculations (isodensity = 0.03 a.u.).](/cms/asset/c7c06feb-d8b1-4de2-9f14-55bd1c9a4b1f/gcic_a_1467315_f0013_oc.jpg)
Figure 14 Total density contours for Au2[MTP(H)]2, AuCu[MTP(H)]2, and Cu2[MTP(H)]2 (isodensity value labeled in each as “Isovalue” in a.u. units).
![Figure 14 Total density contours for Au2[MTP(H)]2, AuCu[MTP(H)]2, and Cu2[MTP(H)]2 (isodensity value labeled in each as “Isovalue” in a.u. units).](/cms/asset/a8f705ef-a7bf-4bc8-8f9b-c869d41a71c9/gcic_a_1467315_f0014_oc.jpg)
Table 11 Natural bond order analysis for AuAg[MTP(Ph)]2 and AuCu[MTP(Ph)]2
Figure 15 Illustration of the donor-acceptor interaction in AuCu[MTP(H)]2 from the Au 5d donor orbital (left) to the Cu 6p orbital (middle) to form the superimposed NBO orbital (right) (isodensity = 0.03 a.u.).
![Figure 15 Illustration of the donor-acceptor interaction in AuCu[MTP(H)]2 from the Au 5d donor orbital (left) to the Cu 6p orbital (middle) to form the superimposed NBO orbital (right) (isodensity = 0.03 a.u.).](/cms/asset/c3747747-39d4-48eb-8c1d-2ca2f3312328/gcic_a_1467315_f0015_oc.jpg)
Figure 16 Calculated normalized absorption spectra of Au2[MTP(Ph)]2, Cu2[MTP(Ph)]2, and Ag2[MTP(Ph)]2 with the highest orbital contribution from Au2[MTP(Ph)]2 (isodensity = 0.03 a.u. for the orbital contours depicted in the inset for the major transition).
![Figure 16 Calculated normalized absorption spectra of Au2[MTP(Ph)]2, Cu2[MTP(Ph)]2, and Ag2[MTP(Ph)]2 with the highest orbital contribution from Au2[MTP(Ph)]2 (isodensity = 0.03 a.u. for the orbital contours depicted in the inset for the major transition).](/cms/asset/05e414f8-7710-4b6f-8353-50a76d9ffb71/gcic_a_1467315_f0016_oc.jpg)
Figure 17 Calculated normalized absorption spectra of Au2[MTP(Ph)]2, Ag2[MTP(Ph)]2 and AuAg[MTP(Ph)]2 (isodensity = 0.03 a.u. for the orbital contours depicted in the inset for the major transition in the AuAg complex).
![Figure 17 Calculated normalized absorption spectra of Au2[MTP(Ph)]2, Ag2[MTP(Ph)]2 and AuAg[MTP(Ph)]2 (isodensity = 0.03 a.u. for the orbital contours depicted in the inset for the major transition in the AuAg complex).](/cms/asset/e42ff6da-178a-4474-ad3f-6c39a3330b14/gcic_a_1467315_f0017_oc.jpg)
Figure 18 Calculated normalized absorption spectra of Au2[MTP(Ph)]2, Cu2[MTP(Ph)]2, and AuCu[MTP(Ph)]2 with the major orbital contribution for the AuCu[MTP(Ph)]2 complex (isodensity = 0.03 a.u. for the orbital contours depicted in the inset for the major transition).
![Figure 18 Calculated normalized absorption spectra of Au2[MTP(Ph)]2, Cu2[MTP(Ph)]2, and AuCu[MTP(Ph)]2 with the major orbital contribution for the AuCu[MTP(Ph)]2 complex (isodensity = 0.03 a.u. for the orbital contours depicted in the inset for the major transition).](/cms/asset/bf428fab-4d58-4e93-9ec6-8fdf643a1535/gcic_a_1467315_f0018_oc.jpg)
Figure 19 Selected molecular orbital contours of the Au2[MTP(Ph)]2 complex with isodensity values varied from 0.02 a.u. (top) to magnify the bonding interaction vs the 0.03 a.u. values used in and other figures.
![Figure 19 Selected molecular orbital contours of the Au2[MTP(Ph)]2 complex with isodensity values varied from 0.02 a.u. (top) to magnify the bonding interaction vs the 0.03 a.u. values used in Figure 3 and other figures.](/cms/asset/7f3752bb-5079-429e-afc5-56e730655300/gcic_a_1467315_f0019_oc.jpg)
Figure 20 Molecular orbital contours of the Cu2[MTP(Ph)]2 complex that manifest a Cu-Cu bonding character upon using 0.02 a.u. isodensity value.
![Figure 20 Molecular orbital contours of the Cu2[MTP(Ph)]2 complex that manifest a Cu-Cu bonding character upon using 0.02 a.u. isodensity value.](/cms/asset/559f51c9-625b-460f-bb6b-0f3a55154f1b/gcic_a_1467315_f0020_oc.jpg)