
Figures & data
Table 1. Sociodemographic and study-related characteristics of the respondents (Australia, N = 165, Switzerland, N = 245)
Table 2. Description of the construct variables among students entering a BSW programme of an university in Australia or Switzerland
Table 3. Comparisons of the scores among the entrant students of the Australian and the Swiss programme regarding interest in research courses, research orientation, fear of research courses, statistics anxiety and general self-efficacy
Figure 1. Path model explaining student’s interest in research courses entering a BSW programme of a university in Australia (N = 161).
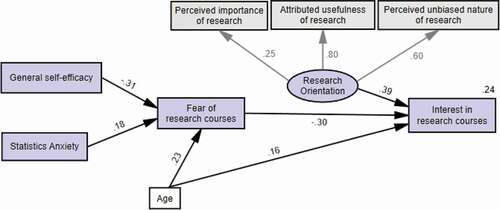
Table 4. Results of the structural equation modelling (standardised regression weights Beta, confidence intervals (95%) and p values) regarding students entering a BSW programme in Australia
Figure 2. Path model explaining student’s interest in research courses entering a BSW programme of a university in Switzerland (N = 244).
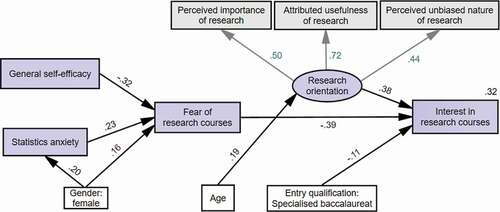
Table 5. Results of the structural equation modelling (standardised regression weights Beta, confidence intervals (95%) and p values) regarding students entering a BSW programme in Switzerland