Figures & data
Table 1. SWM and PS measures compared key criteria for good quality psychological scales.
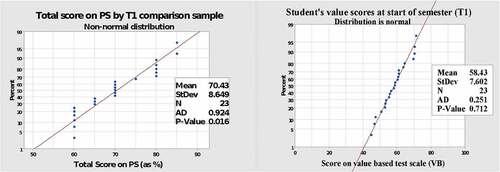
Table 2. Summary of evidence about validity of scores on the PS measure of suitability.
Table 3. Summary of evidence about validity of scores on the SWM measure of suitability.
Table 4. Level 1 T1: Unrotated factor loadings and communalities.
Figure 1. A scree plot of eigen values indicating a two factor solution.
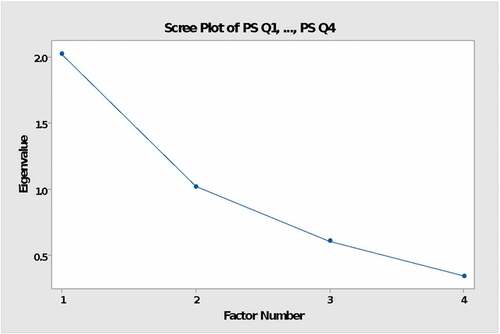
Table 5. Level 1 T1: PS unrotated factor loadings and communalities.
Figure 2. T1 Y1 plot of scores on PS and SWM measure (Vb).
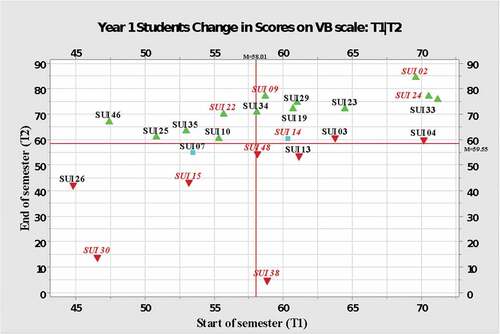
Table 6. Students ranked by % change in VB scores on SWM test: T1 to T2.
Table 7. First Year T1: Pearson (r) matrices: scores on themes and value base (VB).
Table 8. First year T1: spearman’s rho matrices: correlation coefficient of scores on PS criteria themes and overall PS score.
Figure 3. T1 Y1 plot of scores on PS and SWM measure (VB).
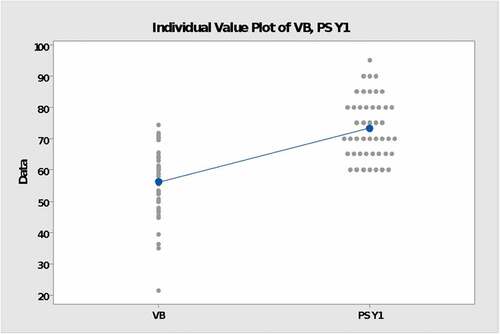
Figure 4. The distribution of scores changes as learning progresses T1 vs T2.
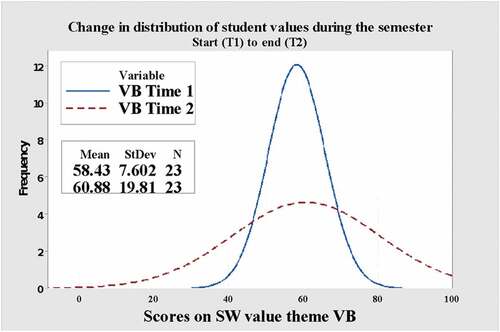
Figure 5. Distinguishability of candidates using the PS and SWM test.