Figures & data
Fig. 1 Current methods in hydro-meteorological network technology, forecasting, hydrological information system architecture and data visualization. In the dashed rectangle, the proposed real-time map information system is indicated (HY. INF. = hydrological information).
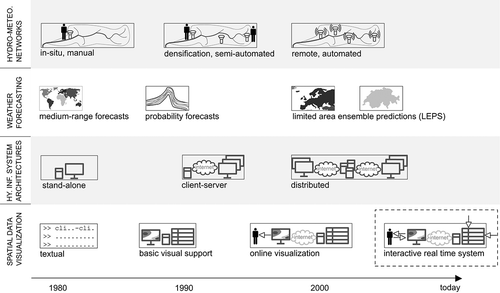
Fig. 2 Conceptual scheme of the real-time map information system. Continuous arrows denote manual database manipulation options provided by user interfaces. Dashed arrows denote automatic real-time data insertions and updates.
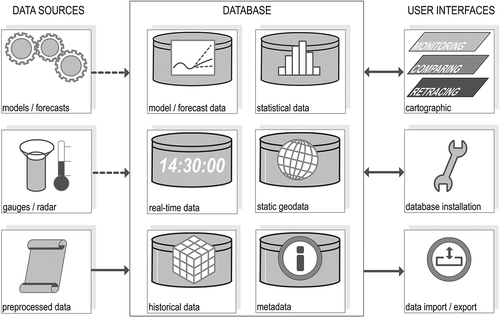
Table 1 Overview of available real-time variables
Table 2 Semantic data problems on different processing levels and suggested real-time solutions
Fig. 3 Database implementation scheme. The gauge file is a text-based overview of gauges provided by network operators.
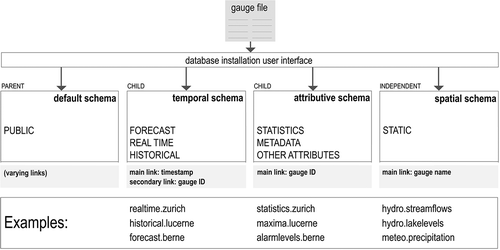
Fig. 6 Map example for temporal comparing of historical streamflow, lake levels, 20-day precipitation sums, air pressure, groundwater levels and precipitation radar. The map shows the situation of 8 August 2007.
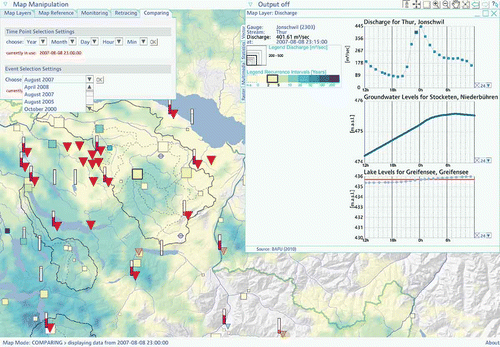
Fig. 7 Nine real-time data visualization examples in the auxiliary window.
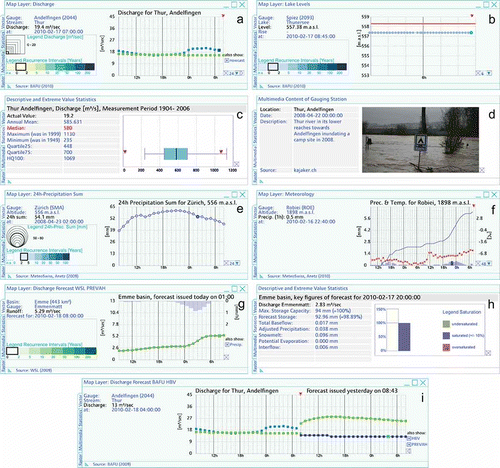
Fig. 4 Interactive map compilation and map viewing procedure.
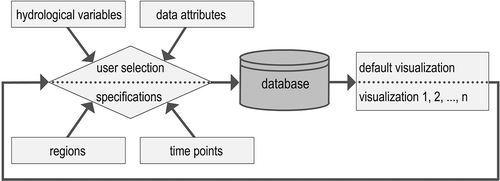
Fig. 5 Map example showing real-time monitoring of streamflow, lake levels, 20-day precipitation sums, snow depths, air pressure, forecast runoff and forecast temperature distribution.
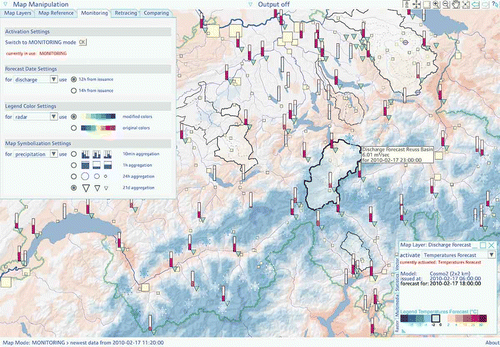
Fig. A1 Map example showing real-time monitoring of snow depth distribution, 0°C-isotherms, lake levels, groundwater levels, air humidity, 24-h precipitation sums and streamflow (as arrows; see text for explanation).
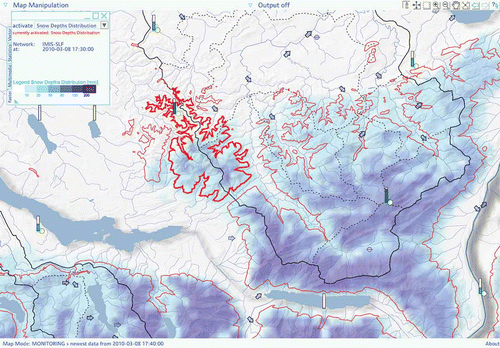
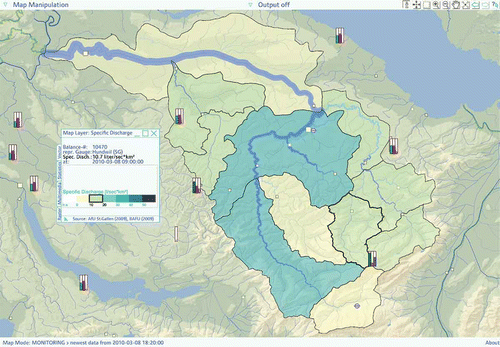
Fig. A2 Map example showing real-time monitoring of streamflow (depicted by squares), by an interpolated band along the river course and by specific discharge areas (L s-1 km-2) for selected hydrological sub-basins. Air humidity, air temperature and air pressure are shown as framed rectangles.