Figures & data
Fig. 1 São Francisco River Basin: river reaches and the locations of large dams and gauging stations of interest.
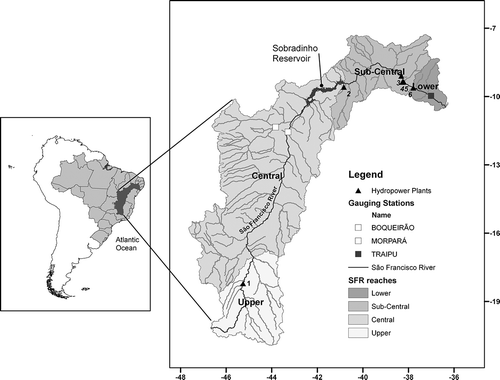
Table 1 Major reservoirs in the São Francisco River
Table 2 Gauging station records
Fig. 2 Average annual flows upstream of the Sobradinho HPP (Morpará + Boqueirão streamflows) and downstream of the Xingó HPP (at Traipu station) and timing of deployment of HPPs.
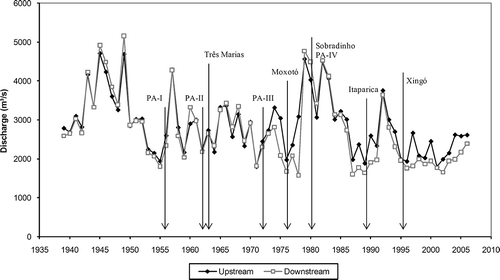
Table 3 Classification of HyC based on the anomaly of annual average streamflow and 1σ
Fig. 3 Anomaly time series of annual average flow upstream of the Sobradinho HPP (Morpará and Boqueirão stations).
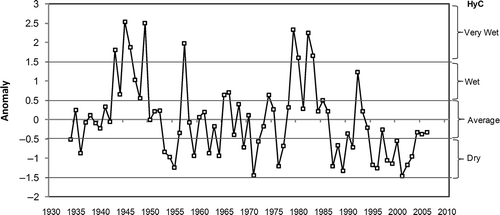
Fig. 4 Flow duration curves obtained by HyC for different classes in the same periods: (a) 1934–2006, (b) 1963–2006, (c) 1979–2006, and (d) 1995–2006. Flow upstream of Sobradinho HPP.
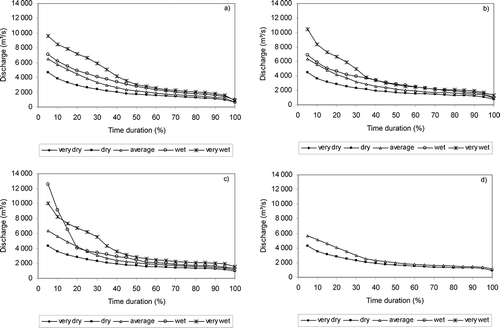
Fig. 5 Flow duration curves obtained by HyC in different periods for the same classes: (a) dry, (b) average, (c) wet, and (d) very wet. Flow upstream of Sobradinho HPP.
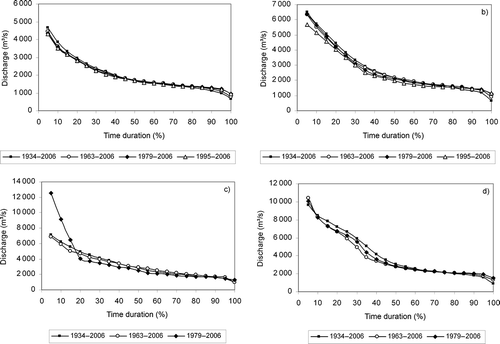
Table 4 Relative error (%) in relation to the streamflow duration curve for the period 1934–2006 (P1). (P2: 1963–2006, P3: 1979–2006, P4: 1995–2006)
Fig. 6 Flow duration curves: upstream and downstream, post-Sobradinho Dam (1979–2006), pre-Sobradinho Dam upstream (1934–1977) and downstream (1939–1977).
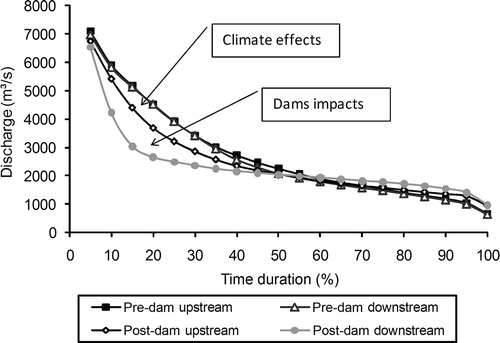
Table 5 Differences in annual volumes and streamflows according to the HyC classes in 109 m3 (m s-1)
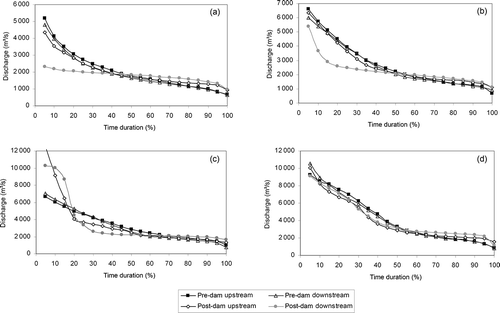
Fig. 7 Flow duration curves for pre- and post-Sobradinho Dam periods (1939–1977 and 1979–2006), upstream and downstream: (a) HyC “dry”, (b) HyC “average”, (c) HyC “wet”, and (d) HyC “very wet”.