1,182
Views
14
CrossRef citations to date
0
Altmetric
Original Articles

Effects of climate and land-use change on green-water variations in the Middle Yellow River, China

Effets du climat et du changement d'utilisation des terres sur les variations des eaux vertes dans le bassin moyen du fleuve Jaune (Chine)

Pages 106-117 | Received 28 Mar 2011, Accepted 04 May 2012, Published online: 14 Dec 2012

Figures & data

Fig. 1 Map of the Yellow River basin. The dotted line shows the Hekouzhen-Longmen drainage area.

Fig. 1 Map of the Yellow River basin. The dotted line shows the Hekouzhen-Longmen drainage area.

Fig. 2 Temporal variation in annual green-water coefficient (C gw) and the amount of green water in the Hekouzhen-Longmen drainage area.
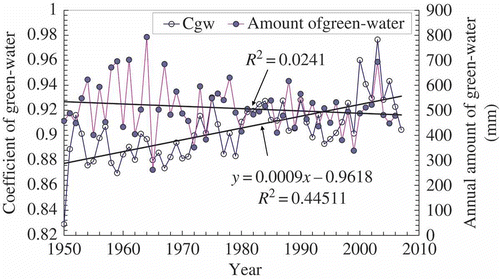
Fig. 2 Temporal variation in annual green-water coefficient (C gw) and the amount of green water in the Hekouzhen-Longmen drainage area.

Fig. 3 Relationship between green water and annual precipitation: (a) annual amount of green water as a function of annual precipitation for different periods; and (b) slope of the equation fitted for five time periods.
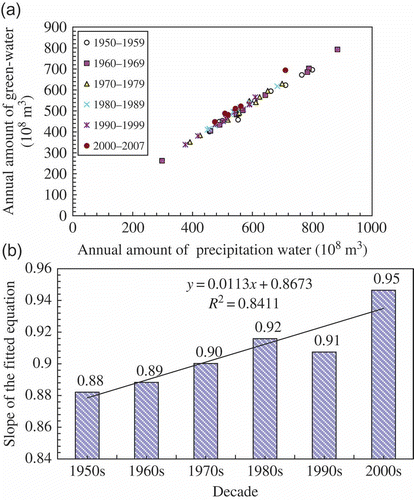
Fig. 3 Relationship between green water and annual precipitation: (a) annual amount of green water as a function of annual precipitation for different periods; and (b) slope of the equation fitted for five time periods.

Fig. 4 Comparison of temporal variation in green-water coefficient (C gw) with that in climate indices: (a) precipitation; (b) summer monsoon intensity, SMI; and (c) air temperature.
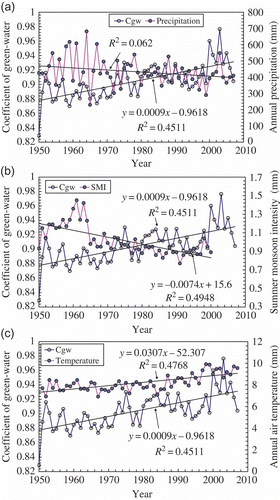
Fig. 4 Comparison of temporal variation in green-water coefficient (C gw) with that in climate indices: (a) precipitation; (b) summer monsoon intensity, SMI; and (c) air temperature.

Fig. 5 Relationships between green-water coefficient (C gw) and 5-year averages of climate indices: (a) summer monsoon intensity, SMI; (b) precipitation; and (c) air temperature.
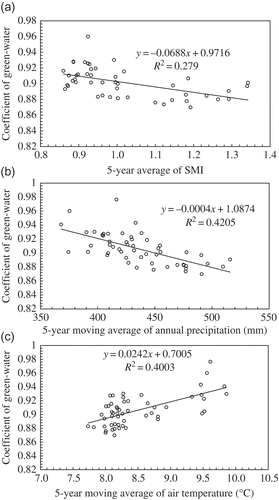
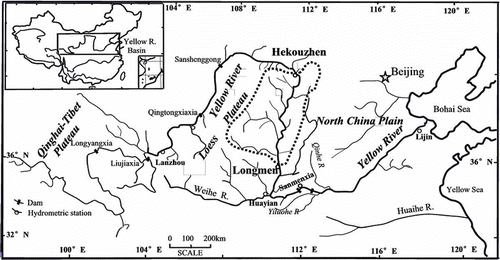
Fig. 5 Relationships between green-water coefficient (C gw) and 5-year averages of climate indices: (a) summer monsoon intensity, SMI; (b) precipitation; and (c) air temperature.
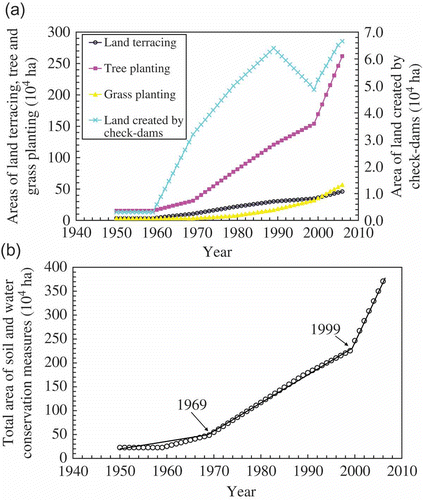
Fig. 6 Variation in time of the area of soil and water conservation measures: (a) four individual measures; and (b) total area of measures.

Fig. 6 Variation in time of the area of soil and water conservation measures: (a) four individual measures; and (b) total area of measures.

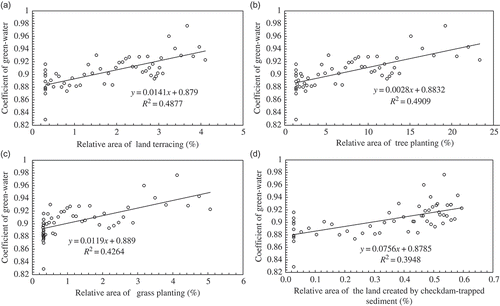
Fig. 7 Relationships between green-water coefficient (C gw) and the relative area of different soil and water conservation measures: (a) land terracing; (b) planting of trees; (c) planting of grass; and (d) the land created by the checkdam-trapped sediment.

Fig. 7 Relationships between green-water coefficient (C gw) and the relative area of different soil and water conservation measures: (a) land terracing; (b) planting of trees; (c) planting of grass; and (d) the land created by the checkdam-trapped sediment.

Reprints and Corporate Permissions

Please note: Selecting permissions does not provide access to the full text of the article, please see our help page How do I view content?

To request a reprint or corporate permissions for this article, please click on the relevant link below:

Academic Permissions

Please note: Selecting permissions does not provide access to the full text of the article, please see our help page How do I view content?

Obtain permissions instantly via Rightslink by clicking on the button below:

If you are unable to obtain permissions via Rightslink, please complete and submit this Permissions form. For more information, please visit our Permissions help page.