3,440
Views
15
CrossRef citations to date
0
Altmetric
Original Articles

The water balance of Lake Kyoga, Uganda

Le bilan en eau du lac Kyoga (Ouganda)

&
Pages 342-353 | Received 19 Dec 2011, Accepted 23 Jul 2013, Published online: 15 Feb 2013

Figures & data

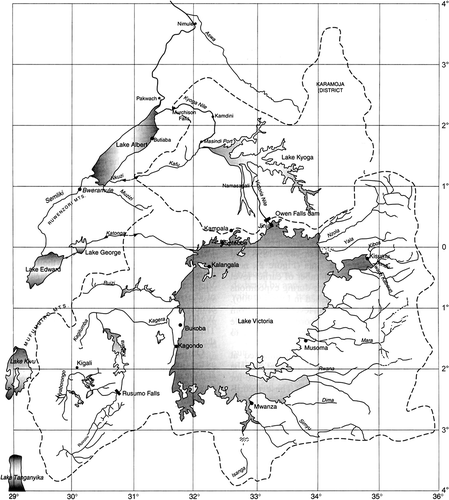
Fig. 1 Map of the East African lake region (after Sutcliffe and Parks 1999).

Fig. 1 Map of the East African lake region (after Sutcliffe and Parks 1999).

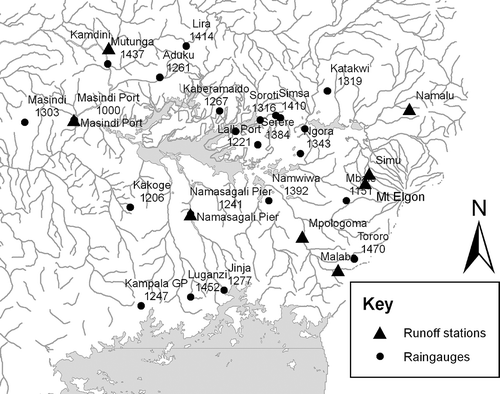
Fig. 2 Lake Kyoga region, including runoff stations and raingauges.

Fig. 2 Lake Kyoga region, including runoff stations and raingauges.

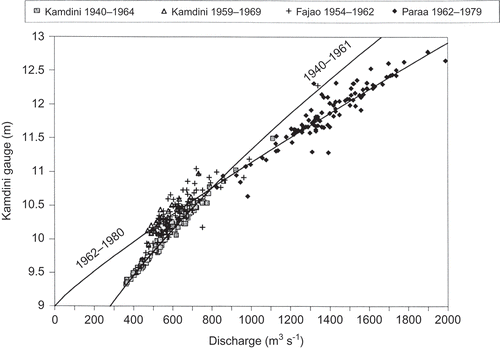
Fig. 3 Gaugings at Kamdini, Fajao and Paraa, 1940–1979 (after Sutcliffe and Parks 1999).

Fig. 3 Gaugings at Kamdini, Fajao and Paraa, 1940–1979 (after Sutcliffe and Parks 1999).

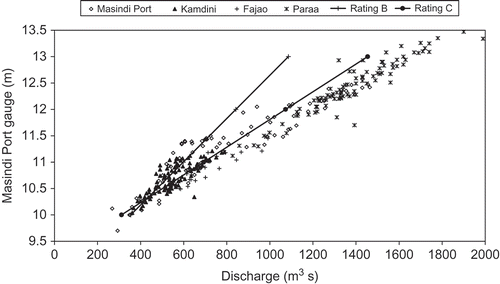
Fig. 4 Gaugings at Masindi Port, Kamdini, Fajao and Paraa, 1922–1978.

Fig. 4 Gaugings at Masindi Port, Kamdini, Fajao and Paraa, 1922–1978.

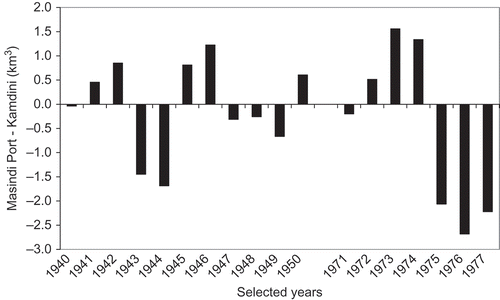
Fig. 5 Differences between annual flows at Masindi Port and at Kamdini, 1940–1977.

Fig. 5 Differences between annual flows at Masindi Port and at Kamdini, 1940–1977.

Table 1 Selected runoff stations in Kyoga basin

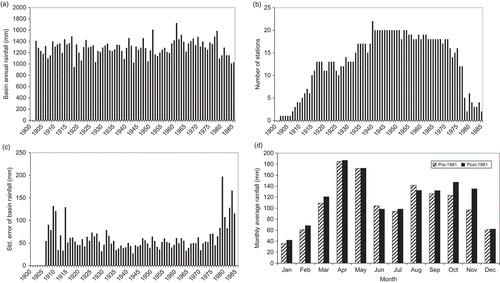
Fig. 6 (a) Basin annual average rainfall, 1902–1985; (b) number of stations used; (c) standard error of estimate; and (d) comparisons of monthly rainfall averages pre- and post-1961.

Fig. 6 (a) Basin annual average rainfall, 1902–1985; (b) number of stations used; (c) standard error of estimate; and (d) comparisons of monthly rainfall averages pre- and post-1961.

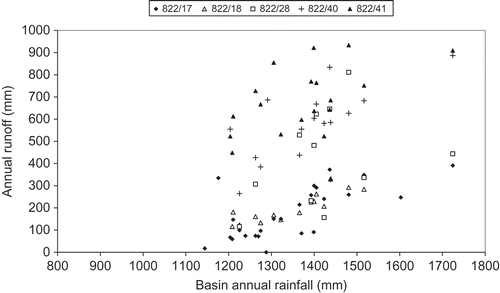
Fig. 7 Annual runoff from selected stations (see for WDD nos) and basin rainfall.

Fig. 7 Annual runoff from selected stations (see Table 1 for WDD nos) and basin rainfall.

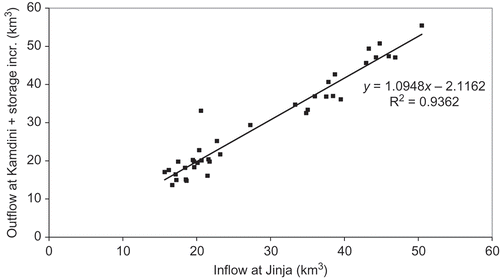
Fig. 8 Lake Kyoga: Kamdini outflow + lake storage change vs Jinja inflow, 1940–1977.

Fig. 8 Lake Kyoga: Kamdini outflow + lake storage change vs Jinja inflow, 1940–1977.

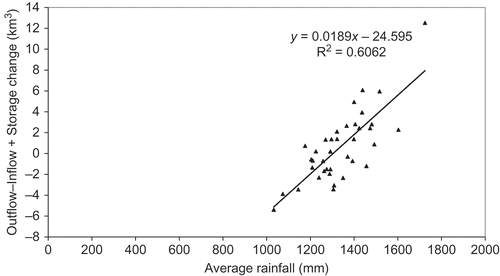
Fig. 9 Lake Kyoga: outflow–inflow + lake storage change vs basin rainfall, 1940–1977.

Fig. 9 Lake Kyoga: outflow–inflow + lake storage change vs basin rainfall, 1940–1977.

Table 2 Lake Kyoga water balance, 1940–1977

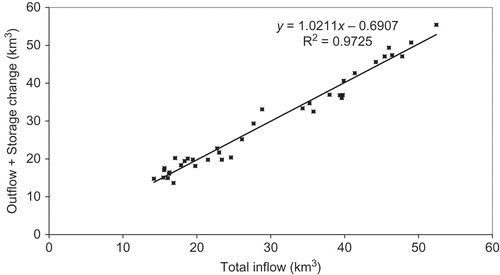
Fig. 10 Lake Kyoga: outflow + lake storage change vs total inflow, 1940–1977.

Fig. 10 Lake Kyoga: outflow + lake storage change vs total inflow, 1940–1977.

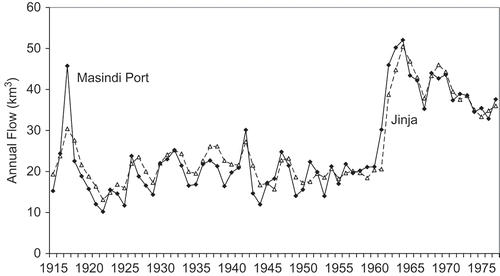
Fig. 11 Annual flows: Masindi Port + lake storage change and Jinja, 1915–1977.

Fig. 11 Annual flows: Masindi Port + lake storage change and Jinja, 1915–1977.

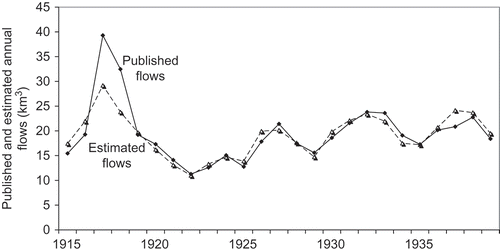
Fig. 12 Masindi Port: published and estimated annual flows, 1915–1939.

Fig. 12 Masindi Port: published and estimated annual flows, 1915–1939.

Reprints and Corporate Permissions

Please note: Selecting permissions does not provide access to the full text of the article, please see our help page How do I view content?

To request a reprint or corporate permissions for this article, please click on the relevant link below:

Academic Permissions

Please note: Selecting permissions does not provide access to the full text of the article, please see our help page How do I view content?

Obtain permissions instantly via Rightslink by clicking on the button below:

If you are unable to obtain permissions via Rightslink, please complete and submit this Permissions form. For more information, please visit our Permissions help page.