Figures & data
Fig. 1 The Brazilian states, Minas Gerais and Ceará, in which the basins employed in the study are located.
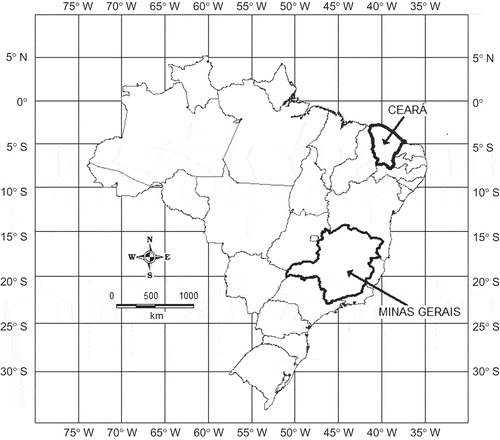
Fig. 2 Flow chart of the runoff production module of the Rio Grande model, which is similar to the Xinanjiang model described by Zhao et al. (Citation1980).
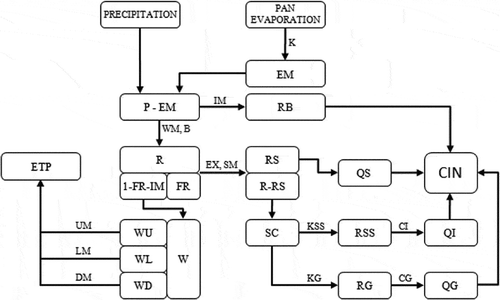
Table 1 Streamflow gauging stations and physical, climatological and morphological characteristics of the basins in Minas Gerais (A: drainage area of basin, L: length of main stream in basin, Hmax: watershed maximum elevation, Hmin: watershed minimum elevation, kc: watershed compactness coefficient, kf: watershed shape coefficient, P: mean annual rainfall, Cesc: runoff coefficient of the basin, given by the relationship between runoff volume and rainfall volume, DD: drainage density, Seq: equivalent slope).
Fig. 3 L-moment ratio diagram for FDCs in Minas Gerais.
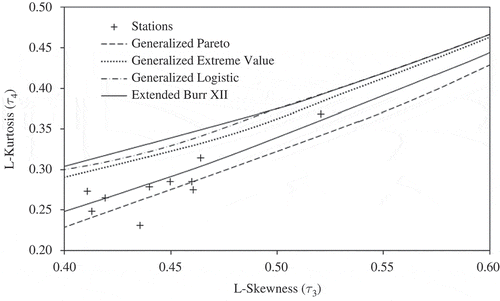
Table 2 Regression equations for the parameters of the extended Burr XII distribution for FDCs (R2: coefficient of determination; R2adj: adjusted coefficient of determination).
Table 3 Regression equations for the parameters of the extended Burr XII distribution for median AFDCs (R2: coefficient of determination; R2adj: adjusted coefficient of determination).
Fig. 4 Scatter plots of CRM and JKM parameters in comparison to MML estimates.
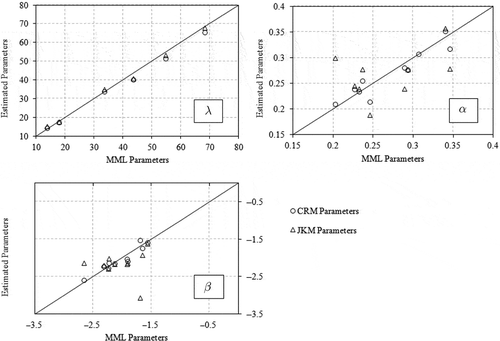
Fig. 5 Comparison between synthetic and observed FDCs at Jaguaruna station (40300001).
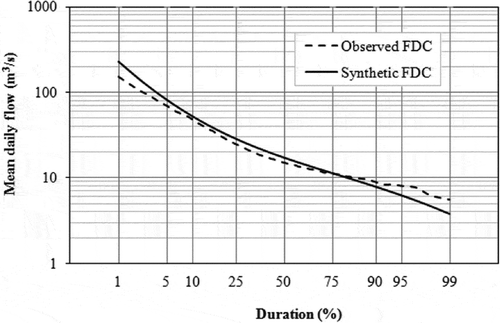
Table 4 Performance indices for the three parameter estimation methods for FDCs (MML: method of L-moments; CRM: complete regional model; JKM: jack-knife model).
Table 5 Performance indices for the three parameter estimation methods for median AFDCs.
Table 6 Performance indices for hydrographs simulated by the Rio Grande model, as calibrated with long-term flow-duration curves (FDCs).
Table 7 Performance indices for hydrographs simulated by the Rio Grande model, as calibrated with median annual flow-duration curves (AFDCs).
Fig. 6 Comparison between the hydrographs simulated by the model calibrated with the FDC and the median AFDC, and the observed hydrograph at Porto Pará gauging station for the hydrological year 1994/95.
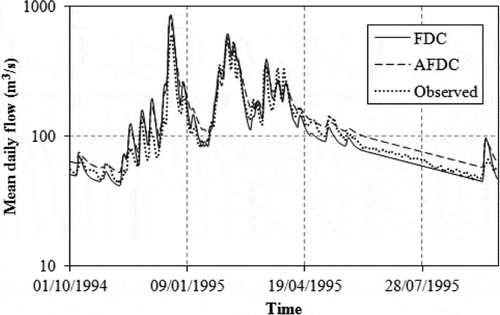
Table 8 Streamflow gauging stations and physical, climatological and morphological characteristics of the basins in Ceará (A: drainage area of basin, L: length of the main stream in basin, CTD: total length of drainage in basin, P: mean annual rainfall, Cesc: runoff coefficient of the basin, Cris: watershed percent area located on fractured rock aquifer).
Table 9 Regression equations for the parameters of the extended Burr XII distribution function for FDCs.
Fig. 7 Scatter plots of CRM and JKM parameters vs MML estimates.
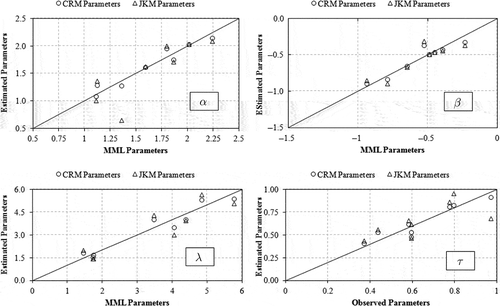
Fig. 8 Comparison between synthetic and observed FDCs at Sítio da Lapinha station (36210000) for estimated τ (a) and observed τ (b).
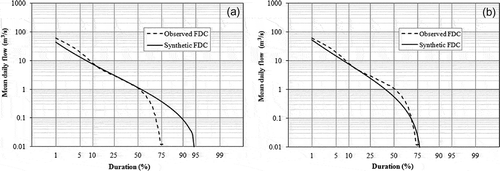
Table 10 Performance indices of FDC models for intermittent streams in Ceará state.
Table 11 Performance indices of hydrographs simulated through parameter calibration with FDCs.
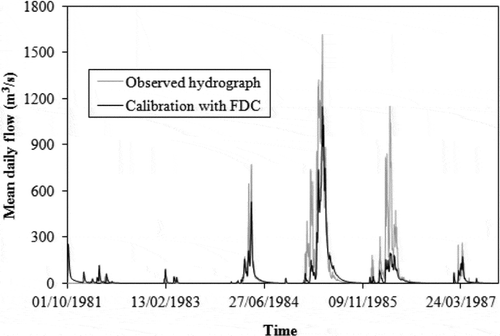
Fig. 9 Comparison between the hydrograph obtained by calibration with the FDC and the observed hydrograph at Fazenda Boa Esperança station for the period 1 October 1981–30 September 1987.