2,309
Views
27
CrossRef citations to date
0
Altmetric
Original Articles

Missing precipitation data estimation using optimal proximity metric-based imputation, nearest-neighbour classification and cluster-based interpolation methods

Estimation des données manquantes des précipitations en utilisant la proximité optimale d’imputation métrique base, la classification du plus proche voisin et méthodes d’interpolation à base de cluster

Pages 2009-2026 | Received 08 Apr 2012, Accepted 11 Sep 2013, Published online: 23 Sep 2014

Figures & data

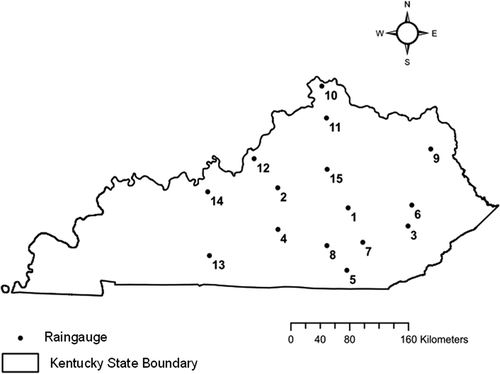
Fig. 1 Location of raingauges in the state of Kentucky, USA (Region I).

Fig. 1 Location of raingauges in the state of Kentucky, USA (Region I).

Fig. 2 Location of raingauges and the gauge with missing data in the state of Florida, USA (Region II).
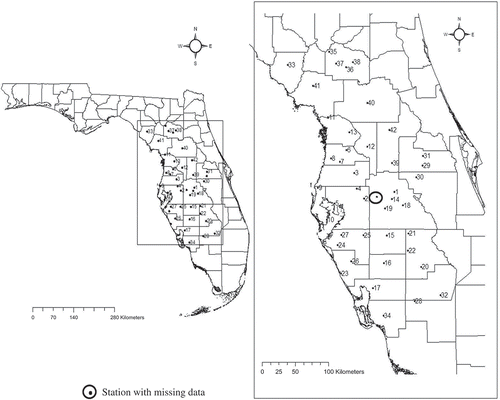
Fig. 2 Location of raingauges and the gauge with missing data in the state of Florida, USA (Region II).

Table 1 Performance measures based on different real-valued distance metrics used in optimal proximity-based imputation for Region I.

Table 2 Performance measures based on different binary proximity measures used in optimal proximity-based imputation for Region I.

Table 3 Performance measures based on different real-valued distance metrics used in optimal proximity-based imputation for Region II.

Table 4 Performance measures based on different binary distance metrics used in optimal proximity-based imputation for Region II.

Table 5 Performance measures based on different threshold values of precipitation for binary distance metric-based imputation for Region I.

Table 6 Performance measures based on different classes used in correlation and optimization-based K-NN classification imputation for Region I.

Table 7 Performance measures based on different classes used in correlation and optimization-based K-NN classification imputation for Region II.

Table 8 Performance measures based on different distance metrics used in optimal K-means cluster imputation for regions I and II.

Table 9 Performance measures based on different methods for regions I and II.

Table 10 Ranking of different imputation methods and their variants for regions I and II.

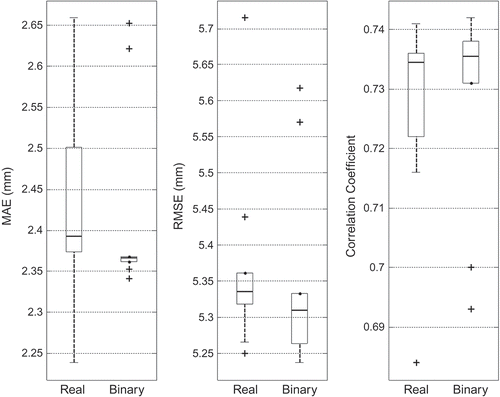
Fig. 3 Variability of performance measures for real and binary metric-based methods for Region I.

Fig. 3 Variability of performance measures for real and binary metric-based methods for Region I.

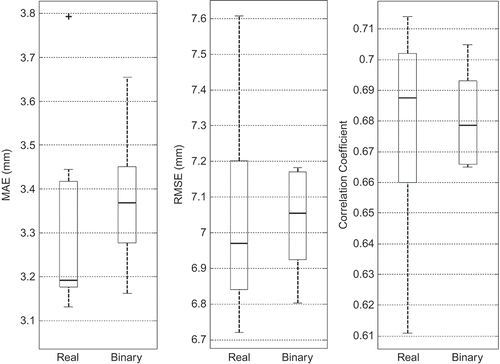
Fig. 4 Variability of performance measures for real and binary metric-based methods for Region II.

Fig. 4 Variability of performance measures for real and binary metric-based methods for Region II.

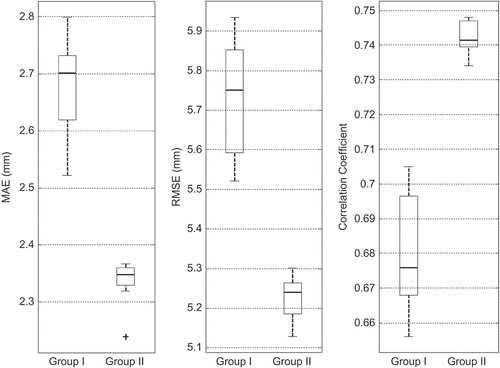
Fig. 5 Variability of performance measures for two groups for Region I.

Fig. 5 Variability of performance measures for two groups for Region I.

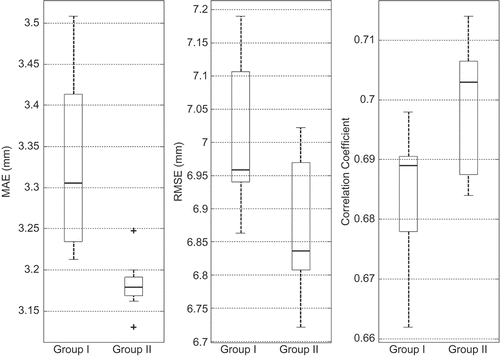
Fig. 6 Variability of performance measures for two groups for Region II.

Fig. 6 Variability of performance measures for two groups for Region II.

Table 11 Performance measures based on application of different methods to different base raingauges in Region I.

Table 12 Performance measures based on application of different methods to different base raingauges in Region II.

Reprints and Corporate Permissions

Please note: Selecting permissions does not provide access to the full text of the article, please see our help page How do I view content?

To request a reprint or corporate permissions for this article, please click on the relevant link below:

Academic Permissions

Please note: Selecting permissions does not provide access to the full text of the article, please see our help page How do I view content?

Obtain permissions instantly via Rightslink by clicking on the button below:

If you are unable to obtain permissions via Rightslink, please complete and submit this Permissions form. For more information, please visit our Permissions help page.