
Figures & data
Table 1 Descriptions of climate forecasting data used for water resources analysis.
Fig. 1 Schematic of technical routing and data processing in this study.
Table 2 Comparison of the current water resources by GSWP2 with previous studies in eight regions and for the world (in km3/year).
Fig. 2 Projected changes in water resources availability in eight regions and the world by the six GCMs. The names of the models giving highest and lowest projections are marked next to the points for the 2070s.
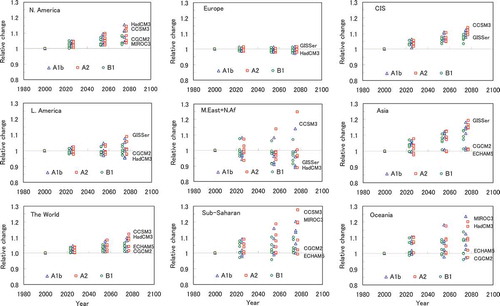
Fig. 3 Potential change directions of available water resources (total runoff) under A1b, A2 and B1 SRES scenarios as simulated by the 6 GCM models in 2020s, 2050s, and 2070s, respectively. SI indicates a significant increasing trend, SD a significant decreasing trend, and MC a subtle change. The area with UC or white shows large uncertainty in change directions among the different GCMs.
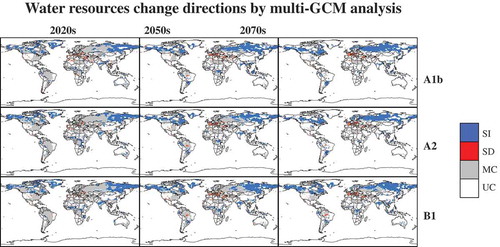
Fig. 4 Distributions of basins with various extents of water stress as defined by the two indices: (a) W/Q and (b) Q/c, in the present time slice.
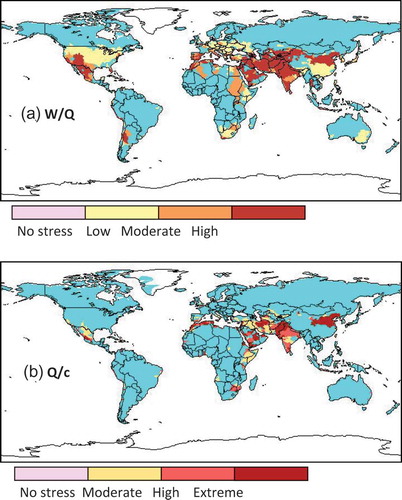
Fig. 5 Distribution of future water stressed basins as defined by W/Q and Q/c in the 2050s and 2075s. The multi-model ensemble mean of discharge was used as the water resource availability (Q).
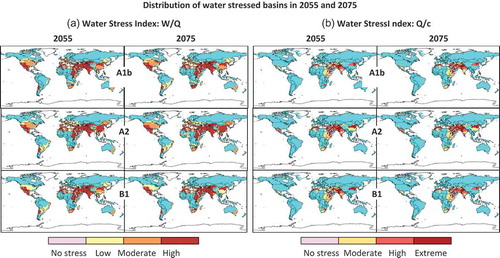
Fig. 6 Current and future projections of highly water-stressed population ratio in the world for scenarios A1b, A2 and B1 measured by (a) W/Q and (b) Q/c. The error bars shows the range caused by water resource projections of different GCMs.
Fig. 7 The highly water-stressed population of eight regions and the world total at present measured by index W/Q. The numbers above each bar illustrate the total population living in highly water-stressed basins in each region. (1: North America; 2: Latin America; 3: Europe; 4: Middle East & North Africa; 5: sub-Saharan Africa; 6: CIS; 7: Asia; 8: Oceania).
Fig. 8 The relative change of highly water-stressed population against 2000 in three future time slices for different regions and globally. The bar graph illustrates the average of the six GCM models; the error bar shows the range amongst the GCMs. (1: North America; 2: Latin America; 3: Europe; 4: Middle East & North Africa; 5: sub-Saharan Africa; 6: CIS; 7: Asia; 8: Oceania. For Region 5, the change rate was scaled by 0.1).
Table 3 Effects of population, socio-economic and climatic changes on worldwide population living in highly water-stressed basins.
Fig. 9 Relative impact of climate warming on the world population living in highly water-stressed basins by six GCMs in different future time slices. The y-axis denotes the ratio of highly-stressed population in Case 3 to that in Case 2. The ratio of highly-stressed population globally calculated using the present and future water availability for each GCM, and the population and water withdrawal vary according to the scenarios and time slices.
Fig. 10 Relative impacts of (a) population, (b) water use and (c) climate on the number of people living in highly water-stressed basins in different regions and the world in 2050s under three different scenarios. Relative impacts are calculated by the ratio of highly-stressed population in Case 1 and 2000; by the ratio of Case 2 and Case 1; and by the ratio of Case 3 and Case 2. (1: North America; 2: Latin America; 3: Europe; 4: Middle East & North Africa; 5: sub-Saharan Africa; 6: CIS; 7: Asia; 8: Oceania).
Fig. 11 Impacts of population, water use and climate warming on water stress level in the 2050s. Background water stress maps represent the situation after the changes in population, water use and climate change based on index W/Q in the 2050s. By comparing any map with the map to its left, readers can understand which basin will be likely to deteriorate or be mitigated from one class of stress level to another due to the changes in water use or climate warming.
Table 4 Comparison of water stressed population in the world with other studies using the indicator Q/c (<1000 m3 c-1 year-1) (in million persons).
Table 5 Comparison of water stressed population in the world with other studies using the indicator W/Q (>0.4) (in million persons).
Table 6 List of the 20 most water-stressed countries at present according to population living in water-stressed basins by index W/Q > 0.4 (The percentage shows the share of highly water-stressed population in the total population).