
Figures & data
Fig. 1 Location of the pilot study area (C5 secondary drainage region).
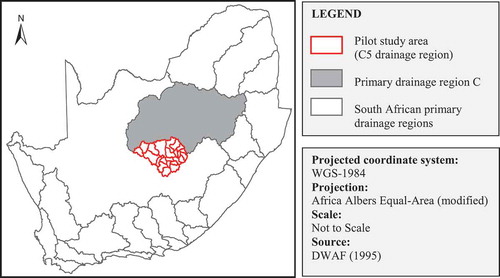
Table 1 Overland flow distances associated with different slope classes (DAWS Citation1986).
Fig. 2 Schematic diagram illustrative of the different time parameter definitions and relationships (after Heggen Citation2003, McCuen Citation2009).
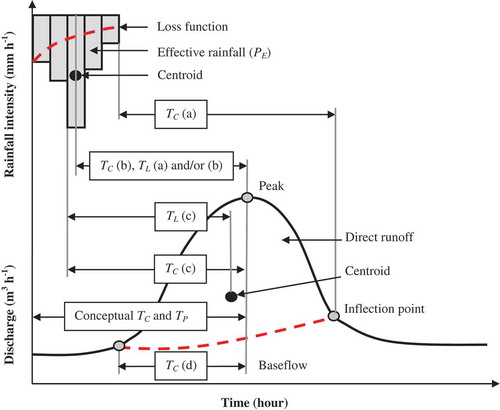
Table 2 Correction factors (τ) for TC (Van der Spuy and Rademeyer Citation2010).
Fig. 3 Conceptual travel time from the centroid of each sub-area to the catchment outlet (USDA NRCS Citation2010).
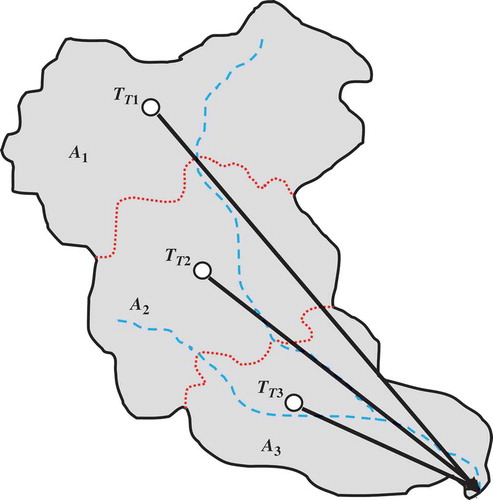
Table 3 Generalized regional storage coefficients (HRU Citation1972).
Table 4 General catchment information. P2: 2-year return period 24-h rainfall depth (mm); PD: unit hydrograph critical storm duration (h); A: area (km2); AC: circle-area (km2) with perimeter = catchment perimeter; P: perimeter (km); W: width (km); LC: centroid distance (km); LH: hydraulic length of catchment (km); LM: max. length parallel to principal drainage line (km); LS: max. straight-line catchment length (km); S: average catchment slope (m m-1); FS1: shape parameter; RC1: circularity ratio; RE: elongation ratio; ip: imperviousness/urbanization factor (%); CN: weighted runoff curve number; C: weighted rational runoff coefficient; CSDF: regional SDF runoff coefficient; CT1: HRU regional storage coefficient; CT2: Snyder’s storage coefficient; CT3: USACE storage coefficient ; CT4: Bell-Kar storage coefficient; LCH: length of channel flow path (km); SCH: average slope of channel flow path (m m-1); ϕCH: channel conveyance factor; τ: USBR channel flow correction factor.
Table 5 Consistency measures for the test of overland flow TC estimation methods compared to the “recommended method” (equation (1)).
Table 6 Comparison of maximum overland flow length criteria.
Fig. 4 TC estimation results.
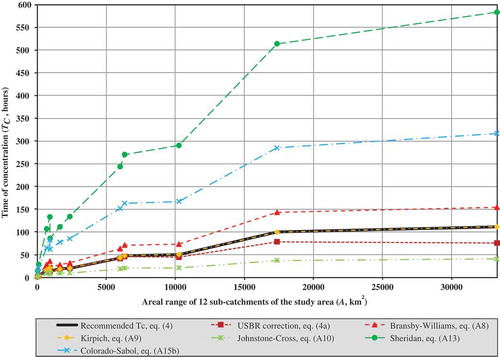
Table 7 Consistency measures for the test of channel flow TC estimation methods compared to the “recommended method”, equation (4).
Fig. 5 TL estimation results.
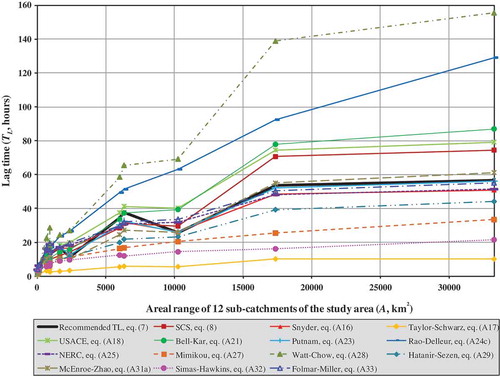
Table 8 Consistency measures for the test of TL estimation methods compared to the “recommended method”, equation (7).
Fig. 6 TP estimation results.
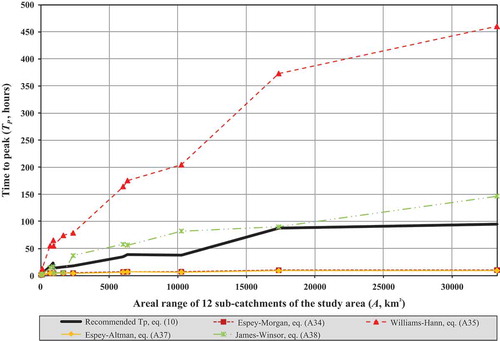
Table 9 Consistency measures for the test of TP estimation methods compared to the “recommended method” (equation (10)).
Table A1 Summary of TC estimation methods used internationally.
Table A2 Summary of TL estimation methods used internationally.
Table A3 Summary of TP estimation methods used internationally.