Figures & data
Fig. 1 The Mod catchment, Jhabua, Madhya Pradesh, India. Main panel: Locations of the transects and sampling points, including the analytical aspect, ephemeral river network (blue) and topography (white contours) superimposed on a composite of bands 5, 3 and 2 of Landsat 7 scene 2000-04-01.Right panel: The geological (GSI Citation1976) and pedological (GSI Citation1988) data basis including the identified transects. The functional soil map is the result of a RS classification of the same Landsat 7 data; the five functional soil classes and three sub-classes as in .
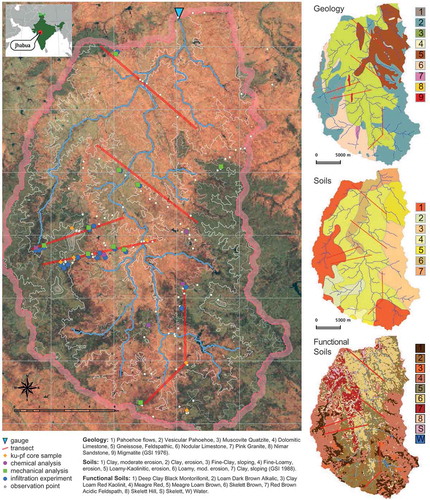
Fig. 2 The spatial and process elements of the hydrological model WASA (after Güntner and Bronstert Citation2004).
Table 1 Overview of the resulting functional soil classes and the mean values of all analysed samples of a class at <0.6 m depth. Skel: mass-percentage of stones (%); Sand, Silt and Clay: mass-percent of the sieved sample, hence without the skeletal fraction (%); Δ: USDA texture class clay / loam / sand; CEC: cation exchange capacity in mol+ per gram of soil (mol+/g); Corg: organic carbon content in per cent of mass (%); z: depth (m); BD: bulk density (g/cm3); θS: saturated water content; θr: residual water content; van Genuchten parameters α (cm-1) and n; and ks: infiltration rate as saturated conductivity (m/s). Values in italics are estimates within the main classes highlighted by the shading.
Table 2 Comparison of total monsoon precipitation to NDVI and agricultural productivity. Kharif and rabi crop productivity are given relative to the mean based on the statistical year books of Jhabua District.
Fig. 3 WASA_crop performance simulated vs gauged discharge for the Mod catchment, 1992–1996. Upper panel: Time series of precipitation and discharge with compressed date axis for dry season. Middle panel: Time series of observed and modelled discharge. Lower panel: Seasonal lag cross-correlation of simulated against observed discharge. The tables present the observed runoff coefficient (Cobs), runoff coefficients from simulations (C), Spearman rank correlation (ρ), and rainfall accumulated (Σ rain) during the season which is reduced to the period of available discharge observation as indicated by the red bars.
Fig. 4 Qualitative validation of modelled soil moisture vs RS soil moisture proxy. Upper row: model results for topsoil moisture in sub-basins. Lower row: mid-IR reflectance of Landsat 7 band 5 at the indicated dates.
Table 3 Data basis of the cropping agent. (a) For each crop, suitability and requirements are listed. The agent ranks the crop depending on accordance with the given strategy and site. (b) and (c) additional soil and cultivation references for which correspond to site specifications.
Fig. 5 Model results using different cropping agents. Upper panel: Simulated biomass production for kharif (top) and rabi (bottom) under the crop setting imposed by the agent. Middle panel: Series of modelled discharge without no-flow periods. Lower panel: Time series of mean soil moisture in the catchment.
Fig. A1 SWAP analysis calibration schemes.
Fig. A2 Overview about SWAP validation results after the respective calibration schemes A–C.
Fig. A3 Comparison of observed and modelled soil moisture dynamics at lysimeter 10_3 (Loess Chernozem Silt Loam) and 7_5 (Cambisol/Stagnosol Loam) as time series from 01-08-1996 with daily time step. Standard refers to a standard parameterization without calibration. Right panel: The box plots present the performance of all validation years for all lysimeters with respect to water balance (R2). The dashed (red) line marks the mean of all realizations within the specific calibration scheme.
Fig. A4 Cross-validation of yield simulation with SWAP using calibrations of the same crop to different soils.