Figures & data
Fig. 1 Location of study area and floodwater spreading system in Iran. The figure shows constructed embankments following the topography.
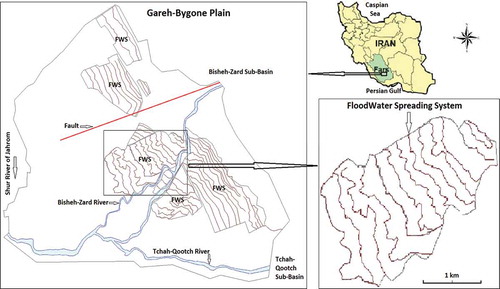
Fig. 2 Average monthly rainfall for Baba-Arab raingauge station from 1972 to 2007.
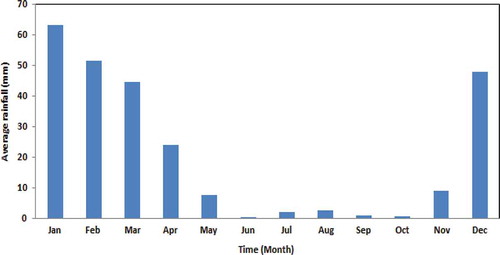
Fig. 3 Schematic representation of a three-basin floodwater spreading system. The length of each basin and consequently the entire system depends on the surface slope (steeper slope means smaller length and smaller slope means larger length).
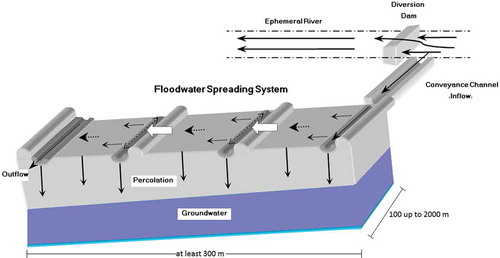
Fig. 4 Hydraulic components of the floodwater spreading system: (a) diversion dam, (b) conveyance channel, (c) spreader/conveyor spreader channel, and (d) water gateway.
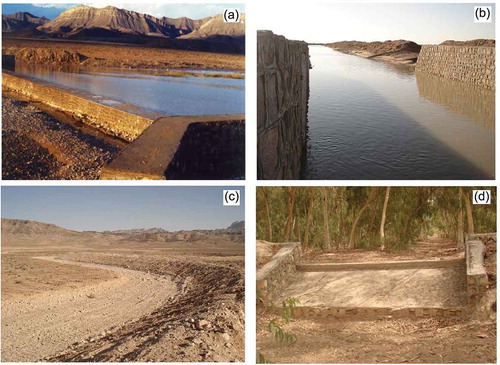
Table 1 Descriptive statistics of available raingauge station data close to the Gareh-Bygone Plain.
Table 2 Descriptive statistics of available discharge station data close to the Gareh-Bygone Plain.
Fig. 5 Schematic of water balance for the study area. Note that groundwater extracted by pumping is included in the ET/extraction term.
Fig. 6 Total monthly rainfall (P, mm), runoff (mm) and groundwater level (GWL, mm) in the upper GBP for the period 1993–2007 (the average GWL change for an observation well, located in the upper part of the GBP, in successive months was multiplied by measured specific yield to be expressed in mm).
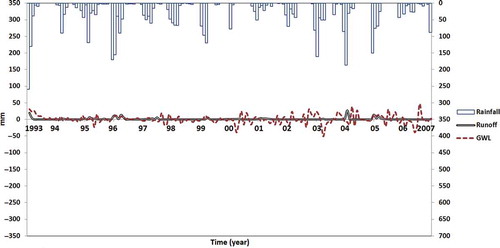
Fig. 7 Total monthly rainfall (P, mm), diverted runoff to the floodwater harvesting system (Qin-surf, mm) and groundwater level (GWL, mm) change for the period 1993–2007 (the average GWL change for all observation wells in successive months was multiplied by measured specific yield to be expressed in mm).
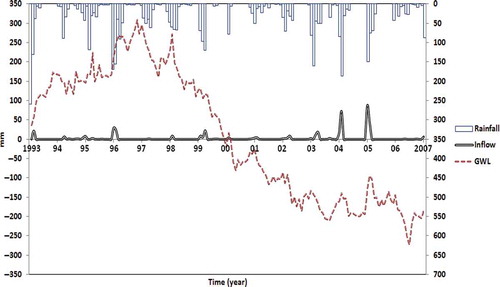
Fig. 8 Total number of drilled new pumping wells in the Gareh-Bygone Plain.
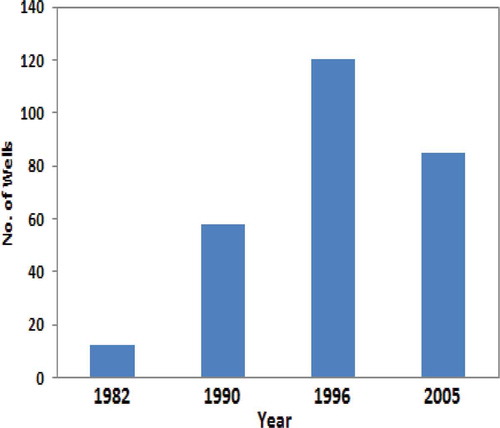
Fig. 9 Scatter plot of observed vs simulated monthly GWL for all boreholes and time series of observed and simulated GWL in one of the selected observation wells between 1993 and 2007 (no simulation was done for 2000 and beginning of 2001 due to missing observations).
Fig. 10 Monthly rainfall (P, Mm3), inflow to the FWS system (Qin-surf, Mm3), and recharge (R, Mm3) between 1993 and 2007.
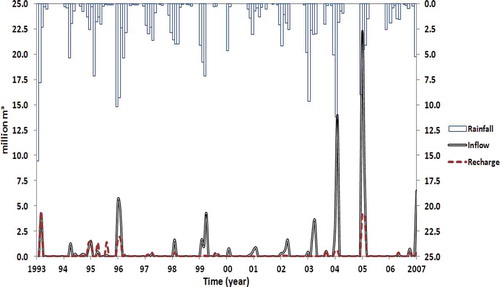
Fig. 11 Number of flood events (defined as delimited by a dry period between two flash floods) in each year during the study period.
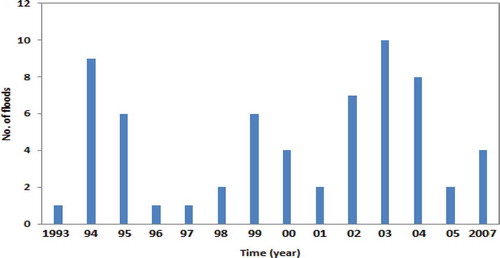
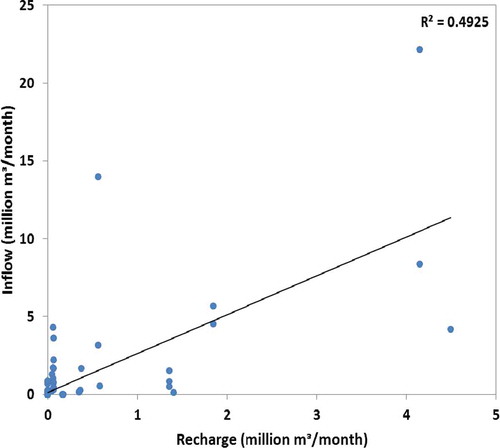
Fig. 12 Relationship between inflow volume to the system and recharge volume.