Figures & data
Fig. 1 Location of the Tondi Kiboro experimental catchment.
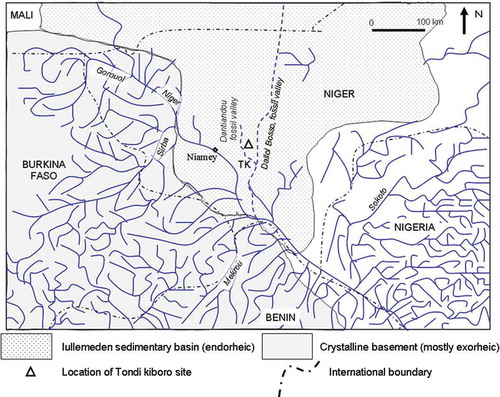
Fig. 2 Schematic diagram of the site of Tondi Kiboro basins.
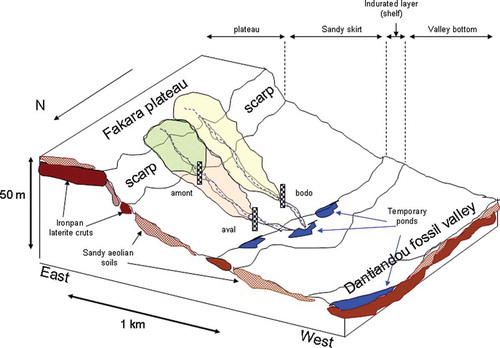
Fig. 3 Instruments implementation in the Tondi Kiboro catchments.
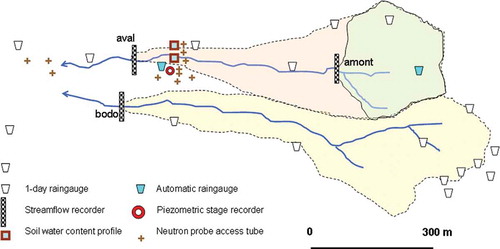
Fig. 4 Annual rainfall in years with hydrological data (mean = 486 ± 97 mm) and for the the whole period (482 ± 93 mm), showing the data to be a representative sample. Data are of the Banizoumbou meteorological station, located 3 km west of the Tondi Kiboro basins.
Fig. 5 Variation of rainfall at the Niamey station since 1900 as a percentage of one standard deviation (y-axis). The two measurement periods (1991–1994 and 2004–2011) are shown.
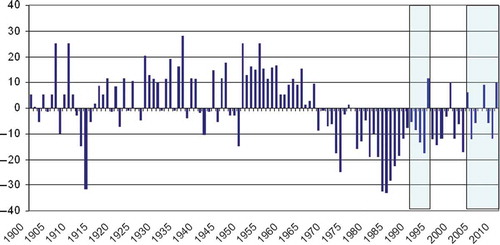
Fig. 6 Arrangement of the soil water content monitoring devices at the soil water monitoring stations.
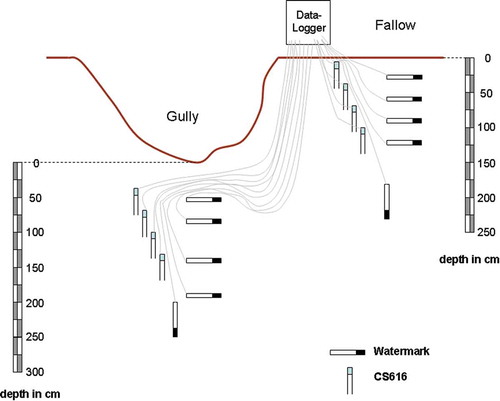
Table 1 Summary of the information on the measurement programme of the implemented network.
Fig. 7 Land cover and surface features in the three sub-basins in 1993 and 2007.
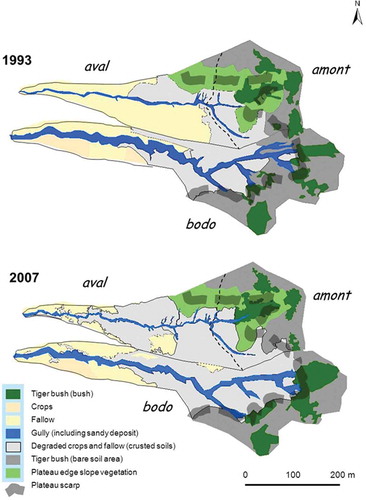
Table 2 Land cover in the three study catchments in 1993 and 2007.
Table 3 Rainfall and runoff data measurements in the three catchments during the two periods: P1: Period 1 (1991–1994) and P2: Period 2 (2004–2011). Kr: runoff coefficient; R: runoff; P: rainfall; r2 reg.: determination coefficient of the regression; N: number of events.
Fig. 8 Hydrograph and hyetograph of Bodo catchment in 2011.
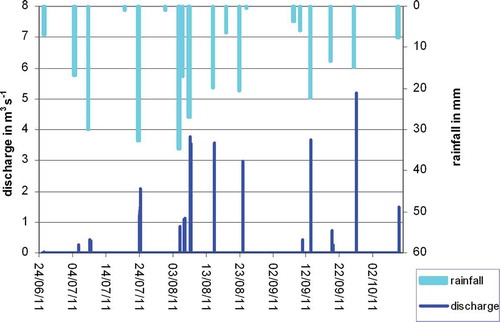
Fig. 9 Hydrograph of the flood of 13 September 2011 at the Aval station.
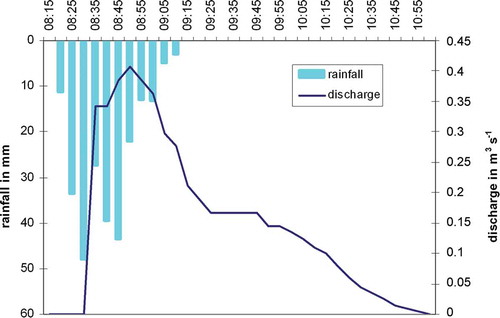
Fig. 10 Rainfall/runoff relationship in Bodo catchment (2007–2011).
Table 4 Depth (m) reached by the wetting front each year, and the 7-year mean, per land use; the date of occurrence of the maximum depth is noted. TB: tiger bush; ERO crust is defined by Casenave and Valentin (Citation1992); SD: standard deviation (highlighted values in bold) were partially reconstructed and N is the number of neutron probe measurement sites (between 10 and 25 depths documented at each site).
Table 5 Runoff coefficient observed in plots (average of four repetitions per class and five measurement years 2004–2008). Kr: runoff coefficient; Ks: hydraulic conductivity.
Fig. 11 Profiles of neutron probe ratio (a surrogate for soil water content) under fallow (top) and under the gully (bottom) as an example in 2006.
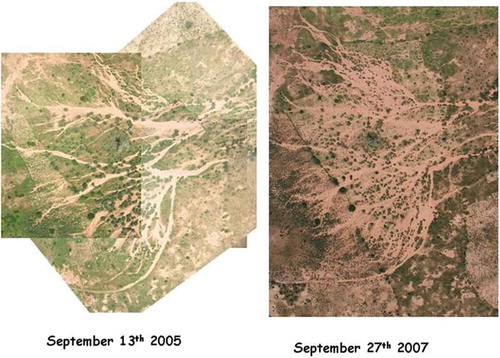
Fig. 12 Extension of the sandy deposit area located downstream from the catchments, between September 2005 and September 2007. A clear extension of sandy deposit is observed.