Figures & data
Fig. 1 Catchment map of the Hailiutu and Huangfuchuan rivers.
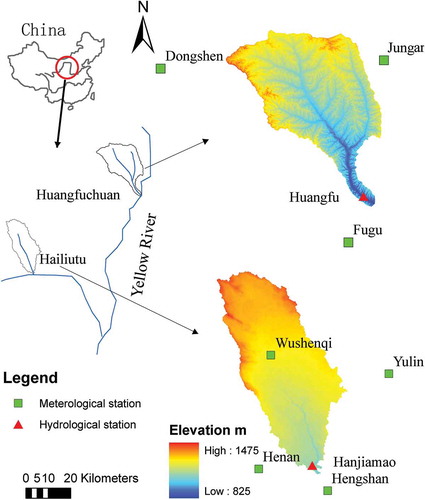
Fig. 2 Geomorphological map of the Erdos Plateau (from the Xi’an Geological Survey Centre).
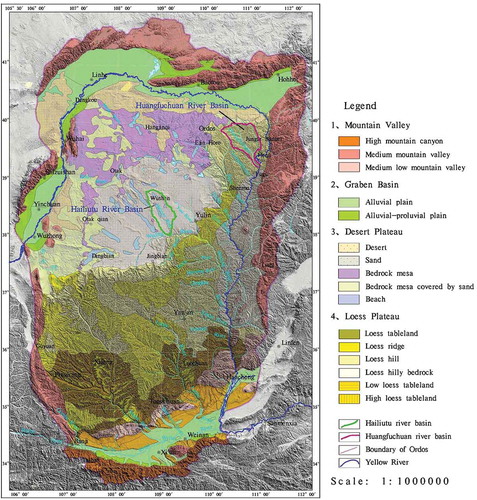
Fig. 3 Flow regime shifts of annual mean discharges of (a) the Hailiutu River (four flow regime change points in 1968, 1986, 1992 and 2001); (b) the Huangfuchuan River (two flow regime change points in 1968 and 1999); and (c) departures of annual mean discharges from their step trends.
Fig. 4 Scatter plot of monthly mean discharge (runoff depth in mm) vs monthly precipitation in the Huangfuchuan and Hailiutu catchments.
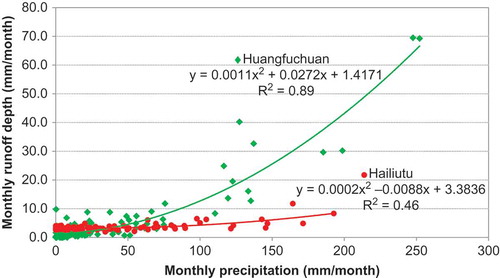
Table 1 Statistical characteristics of river discharges.
Fig. 5 Seasonal variation in monthly mean discharge in (a) the Hailiutu and (b) the Huangfuchuan rivers.
Fig. 6 Variation of daily mean discharge in relation to rainfall in 1967 in (a) the Hailiutu and (b) the Huangfuchuan rivers.
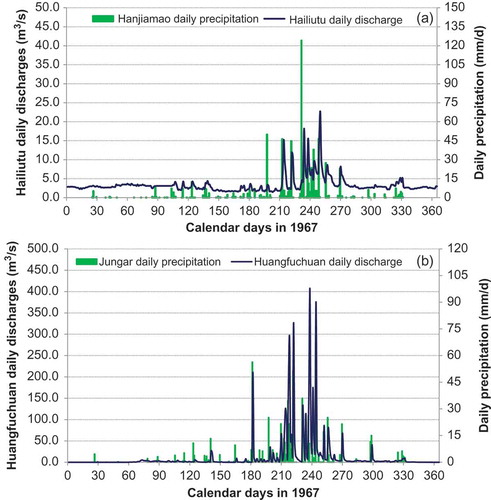
Fig. 7 Flow duration curves of the mean daily discharges of the Hailiutu and Huangfuchuan rivers.
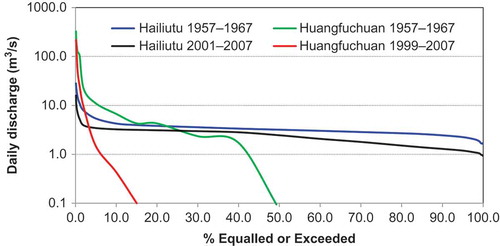
Fig. 8 Comparison between (a) annual precipitation, (b) annual mean temperature, and (c) annual pan evaporation in the Hailiutu and Huangfuchuan catchments.
Table 2 Statistical characteristics of annual precipitation and pan evaporation.
Fig. 9 Differences in slopes in the Hailiutu and Huangfuchuan catchments.
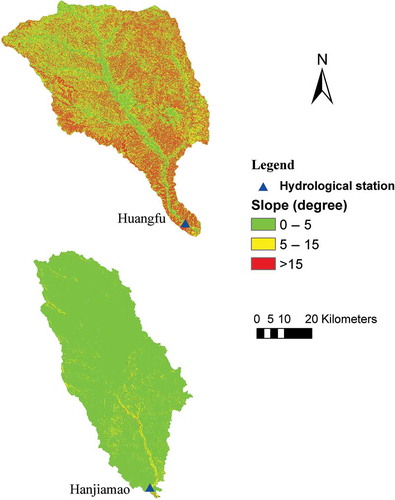
Table 3 Differences in slope in the two catchments.
Fig. 10 Differences in baseflow index between the Hailiutu and Huangfuchuan rivers.
Fig. 11 Distribution of NDVI in the Hailiutu and Huangfuchuan catchments, 10 July 2010.
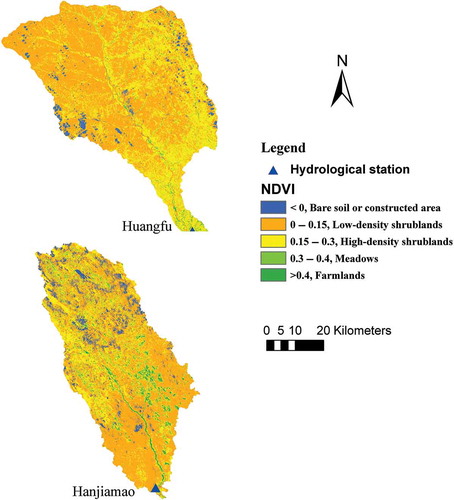
Fig. 12 Comparison of NDVI index between the Hailiutu and Huangfuchuan catchments, 10 July 2010.

Table 4 Correlation between annual mean river discharge and causative factors.
Fig. 13 Scatter plot of measured annual mean runoff depth against that predicted by regressions for (a) the Hailiutu and (b) the Huangfuchuan.