
Figures & data
Fig. 1 Set-up of the rainfall simulator (model DIK-6000, Daiki Rika Kogyo Co., Japan) and the shrub species for the experiment: (a) C. korshinskii; (b) H. scoparium; and (c) A. ordosica.
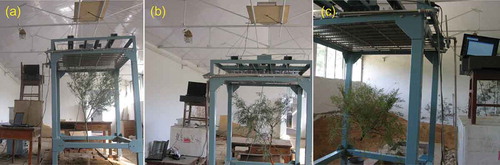
Fig. 2 Canopy storage per (a) canopy area; (b) canopy volume; (c) dry biomass; (d) shrub volume; (e) leaf area of shrubs C. korshinskii (CK), H. scoparium (HS), and A. ordosica (AO) varying with five raindrop sizes. Values are equilibrium storage averaged across all tests for each species (n = 6). Vertical bars represent standard error.
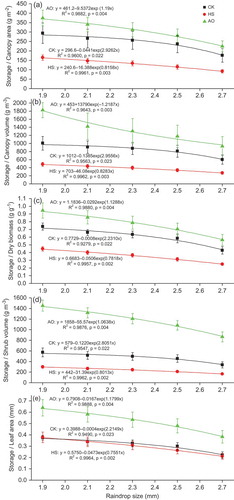
Fig. 3 Example data from tests of rainfall simulation on shrubs. In each case, the black line is the depth-equivalent mass of water stored on the shrub canopy, vertical dashed lines indicate step decreases in raindrop size (shown on the upper panel). Dips in stored water are the result of 3-min rainfall pauses.
Fig. 4 Relationship between water storage and biomass for (a) C. korshinskii and (b) H. scoparium and (c) shrub volume for A. ordosica under simulated rainfall with mean raindrop size of 2.3 mm (range from 1.7 to 2.9 mm).
Table 1 Coefficient of variation (%) between canopy storage (S, g) versus leaf area (LA, cm2), dry biomass (DB, g), canopy area (CA, cm2), canopy volume (CV, cm3) and shrub volume (SV, cm3), respectively, for the xerophytic taxa tested (n = 6).