
Figures & data
Table 1 Upper critical temperatures ranges (°C) for survival and feeding of Atlantic salmon (Salmo salar) and brook trout (Salvelinus fontinalis). Adapted from Elliott and Elliott (Citation2010), Jonsson and Jonsson (Citation2009) and Breau et al. (Citation2011).
Fig. 1 Locations of the meteorological stations and water temperature monitoring sites in each of the three drainage basins: (a) St Marguerite, (b) Ouelle, and (c) LSWM. M and R with site numbers respectively designate mainstem (M) and paired cooler refugia (R) tributary waters.
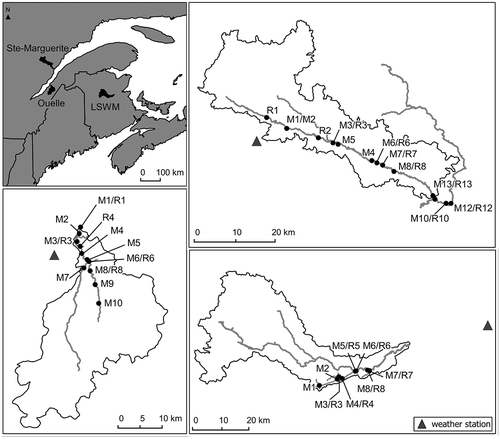
Table 2 Characteristics of the river basins.
Table 3 Water temperature monitoring sites and corresponding length of water temperature records. M# codes designate sites in the mainstem of the river and R# codes identify potential refugia. Refugium-mainstem pairs are identified by the same number.
Fig. 2 Summer air temperature, precipitation and water temperature for the M6-R6 mainstem-refugium pair located on the Ouelle, for 2010.
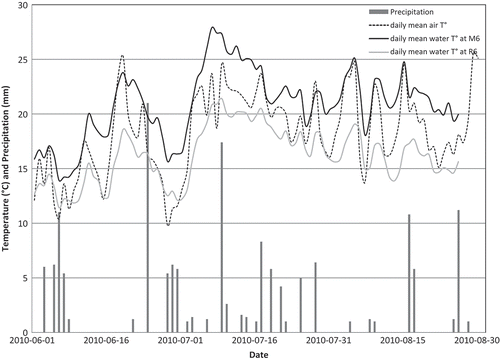
Fig. 3 Top: Inter-annual mean daily air temperature recorded at Miramichi RCS meteorological station between 1970 and 1999 (light grey line) and the modelled seasonal component (dark line). Bottom: air temperature residuals for 1995.
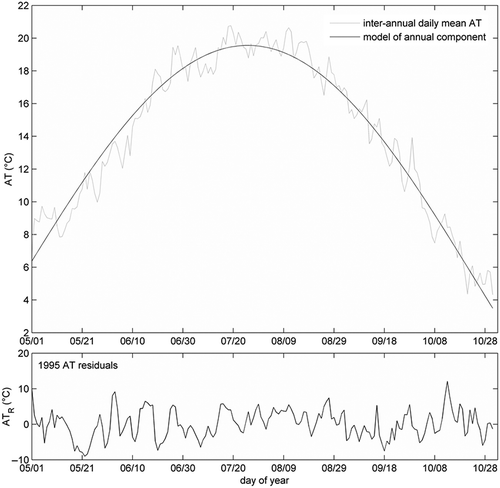
Table 4 Climate models and SRES scenarios employed in the present study.
Table 5 Temperature metrics used to compare reference (1970–1999) and future (2046–2065) simulated water temperature regimes. Each statistic is computed over the whole series.
Fig. 4 Observed and simulated summer daily minimum, mean and maximum water temperatures at site M7 on the Ouelle, for 2001 (top row), 2002, 2003, 2008, 2009 and 2010 (bottom row). RMSE values for predicted daily minimum, mean and maximum temperatures at this site are 1.4, 1.3 and 1.9°C, respectively.
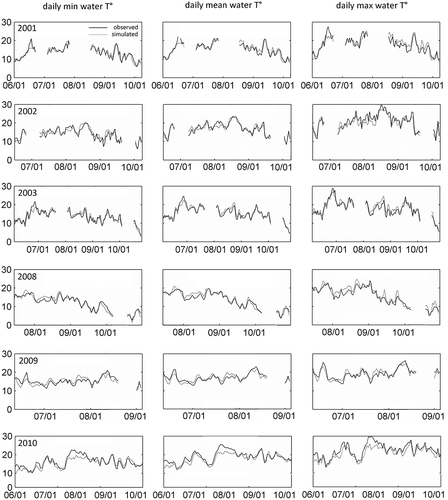
Fig. 5 Distributions of the RMSE validation and simulation values for predicted daily minimum, mean and maximum temperatures at all sites.
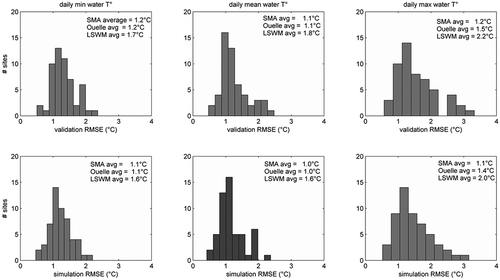
Table 6 Daily mean temperatures (°C) for June–September computed from the water temperature time series simulated given historical (1970–1999), reference (1970–1999) and future (2046–2065) air temperature and precipitation data. Median and standard deviations (SD) of the 10 values obtained using the 10 climate scenarios are shown for every site. Sites on the same line are refugium-mainstem (R-M) pairs.
Table 7 Mean summer temperature contrast across refugium-mainstem pairs (R-M pair contrast, °C); computed from the water temperature time series simulated given historical, reference and future air temperature and precipitation data.
Fig. 6 7Dmax, %max24, %max28, Dmax24, Tmax24 and %min20 values computed for all mainstem sites and all 10 climate scenarios in the three basins, for reference and future periods. On each box plot, the horizontal line is the median value, the edges of the box are the 25th and 75th percentiles, the vertical dashed line extend to the most extreme values not considered outliers, and the crosses are outliers.
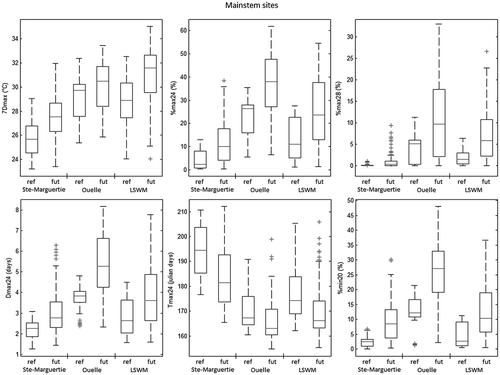
Fig. 7 7Dmax, %max24, %max28, Dmax24, Tmax24 and %min20 values computed for all refugia sites and all 10 climate scenarios in the three basins, for reference and future periods.
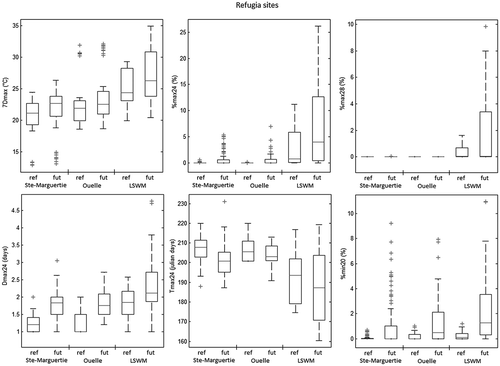
Table A1 7-day maximum daily temperature (7Dmax) computed from the water temperature time series simulated given historical, reference and future air temperature and precipitation data. SD: standard deviation.
Table A2 Percentage of days with maxima exceeding 24°C (%max24); computed from the water temperature time series simulated given historical, reference and future air temperature and precipitation data.
Table A3 Percentage of days with minimum temperature exceeding 20°C (%min20); computed from the water temperature time series simulated given historical, reference and future air temperature and precipitation data.
Table A4 Duration (in days) of events exceeding 24°C daily maxima (Dmax24); computed from the water temperature time series simulated given historical, reference and future air temperature and precipitation data.
Table A5 Timing of first event exceeding 24°C daily maxima (Tmax24); computed from the water temperature time series simulated given historical, reference and future air temperature and precipitation data.