
Figures & data
Fig. 1 Location of the study area in the Odiel River (Huelva, Spain). Contaminated and uncontaminated drainage channels are shown together with the location of the main mine operations (source: Sarmiento et al. Citation2009a). Blue stars are water sampling locations for geochemical analysis contemporaneous to the dates of HyMap flights. Black rectangles frame mapped areas.
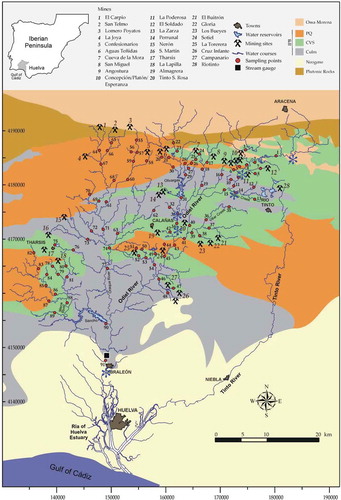
Fig. 2 Sequence of hyperspectral image processing to produce a map of acidic water.
Fig. 3 Sequential subscenes produced by image processing (from left to right): (a) false colour composite with HyMap channels 7 (0.5602 µm), 34 (0.9414 µm) and 110 (2.2450 µm); (b) minimum noise fraction transform showing the flow path and water; (c) mask for the flow path; (d) map of sediments (in Riaza et al. Citation2012a); (e) mask for mud and water; (f) map of water and mud (in Riaza et al. Citation2012b); (g) mask for deep water; and (h) map of acidic water.
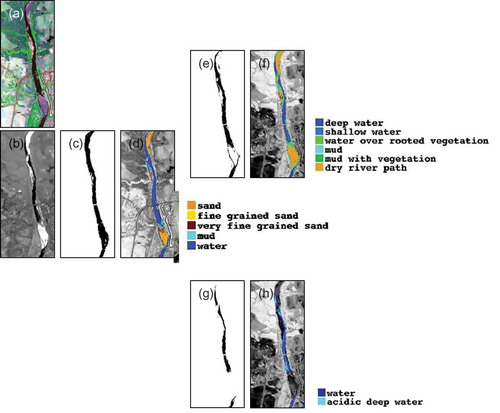
Fig. 4 (left) The first input of intensely contaminated water in the river: maps of (a) deep water with different pH and (b) water, from HyMap data on 1 August 2008. Maps of (c) deep water and (d) water, from HyMap data on 13 August 2009. Right: seasonal summer maps of temperature and precipitation for the corresponding years (source: AEMET). Temperature legend: EC: extremely warm (exceeds maximum recorded for the reference period 1961–1990); MC: very warm (within 20% of the span of the warmest years of 1961–1990); C: warm (within 20% and 40% of the warmest years of 1961–1990); N: normal within 40% and 60% of 1961–1990); F: cold (within 60% and 80% of 1961–1990); MF: very cold (within 80% of 1961–1990); EF: extremely cold (temperatures recorded do not reach the minimum value recorded during the reference period). Precipitation: EH: extremely wet (precipitation exceeded the maximum recorded for the reference period 1971–2000); MH: very wet (within 20% of the span of wettest years of 1971–2000); H: wet (within 20% and 40% of wettest years); S: dry (within 60% and 80% of 1971–2000); MS: very dry (within the 80% of 1971–2000); ES: extremely dry (precipitation does not reach the minimum value recorded during 1971–2000).
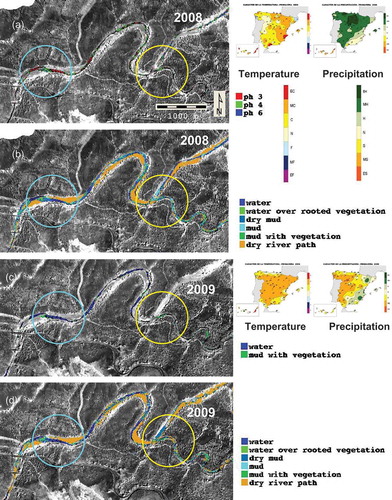
Fig. 5 (a) HyMap spectra of the end-members mapped as pH associated with water at the first input of intensely contaminated water in the river. (b) Field spectra of water with different pH measured in the field at the first input of intensely contaminated water in the river.
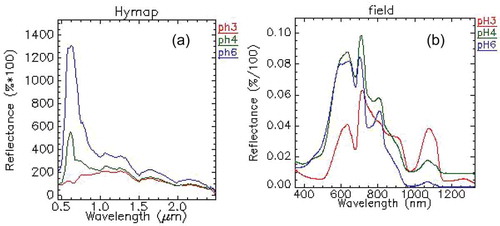
Fig. 6 The mine site along the river. Top row: Temperature and second row: precipitation. Seasonal (summer) maps for corresponding year of flights (AEMET):.(a) false colour composite image with HyMap channels 16 (0.6755 µm), 26 (0.8188 µm) and 108 (2.1917 µm). Mineworks are enhanced in light colour on the western bank of the river. (b)–(d) Maps of acidic deep water built from HyMap data on 17 June 2005, 1 August 2008, and 13 August 2009, respectively. See for explanation of colours and maps.
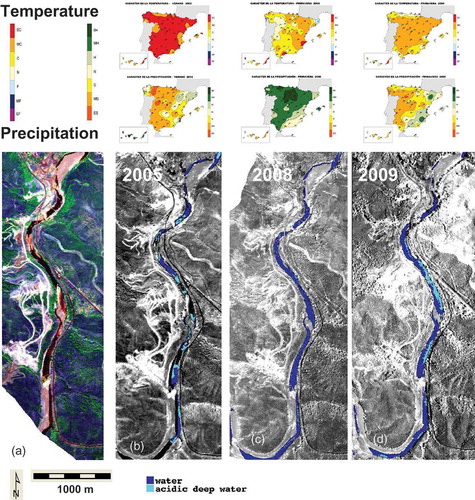
Fig. 7 HyMap spectra of the end-members used to build the map of water and mud (cf. and (f)) (source: Riaza et al. Citation2012b).
Table 1 Summary of relevant spectral features on the HyMap spectra (see ) of the end-members used to build the map of water and mud (). ‘max’ and ‘min’ refer to maximum and minimum reflectance shown by the corresponding spectra in the graphs of . ‘end’ describes the wavelength at which the spectral response stops in a particular spectrum. Particularly enhanced spectral features are in bold font.
Fig. 8 Mosaic with the six HyMap flight lines covering the flow path of the River Odiel in 2008, with test sites and locations of field spectral measurements. (A)–(H): Field spectra of water measured with an ASD Fieldspec 3 spectrometer in locations corresponding to (a)–(h) along the river flow path, with expression of the water pH measured on the ground contemporaneous to the field spectral measurements.
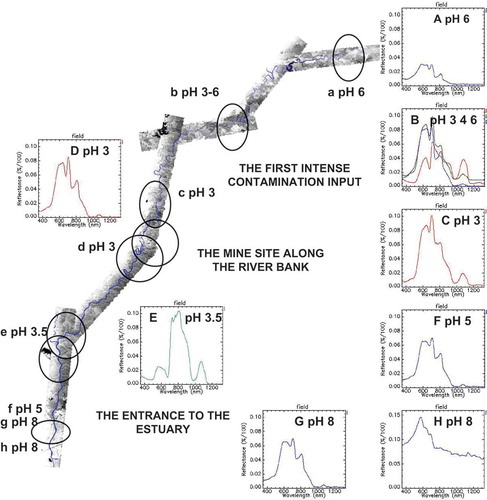
Table 2 Summary of relevant spectral features on field reflectance spectra of river water according to pH and other parameters (see ). See and text for explanations.