
Figures & data
Fig. 1 Map shows administrative divisions (in bold letters) of Sudan and the 39 grid cells (1.0° latitude × 1.5° longitude) utilized in the study.
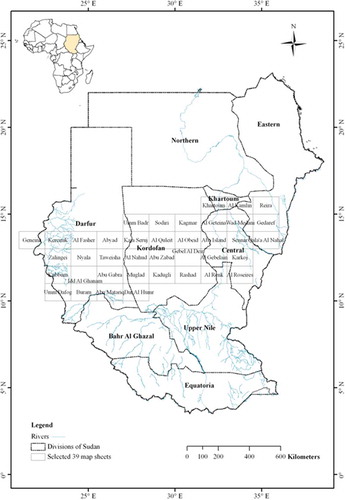
Fig. 2 Daily rainfall and measured (Ardö Citation2013) and modelled (WATBAL) soil moisture contents during two periods, 1/2/05–20/4/07 and 6/7/07–19/1/10, for the Demokeya site, in northern Kordofan (Al Obeid grid cell).
Fig. 3 Scatter plot of the measured (Ardö Citation2013) and modelled (WATBAL) soil moisture contents for 1/2/05–20/4/07 and 6/7/07–19/1/10 for the Demokeya site, in northern Kordofan (Al Obeid grid cell). Dotted line is the 1:1 line.
Table 1 Long-term mean annual temperature (MAT), mean annual precipitation (MAP) and modelled (WATBAL) water balance components for AR and VR soil types for each grid cell (see ).
Fig. 4 Grid cell modelled long-term annual water balance components as a percentage of mean annual precipitation (MAP) for AR and VR soil types. Grid cells are ranked according to MAP (increasing to the right).
Fig. 5 Map showing distribution of mean annual precipitation (MAP) and mean annual temperature (MAT) across the study region (see for location of study region in Sudan).
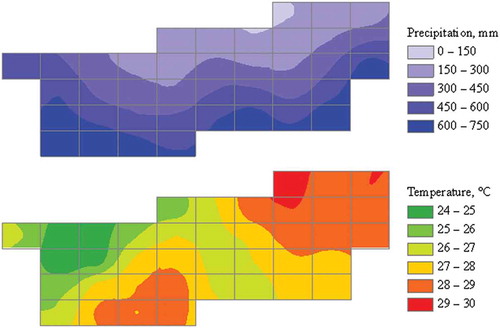
Fig. 6 Map showing distribution of annual ET for AR and VR soil types across the study region (see for location of study region in Sudan).
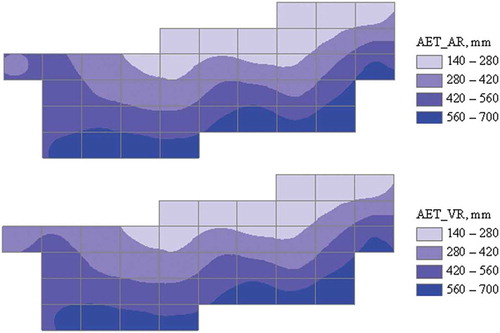
Fig. 7 Map showing distribution of annual runoff for AR and VR soil types across the study region (see for location of study region in Sudan).
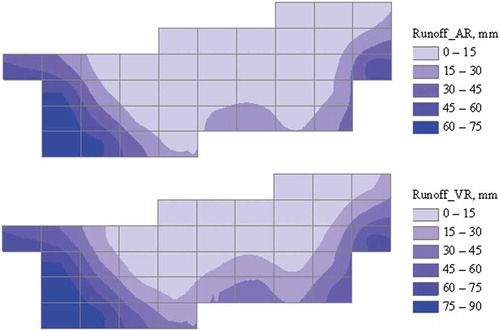
Fig. 8 Map showing distribution of annual drainage for AR soil type across the study region (see for location of study region in Sudan).
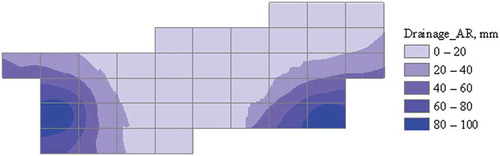
Table 2 Descriptive statistics of annual rainfall, temperature and WATBAL modelled water balance components for AR and VR soil types for the Rashad grid cell (11.5°N, 30.75°E) during 1961–1990.
Fig. 9 Annual rainfall and WATBAL modelled water balance components for AR and VR soil types for the Rashad grid cell (11.5°N, 30.75°E) during 1961–1990. Mean annual temperatures (MAT, °C) during the same period are given on the secondary y-axis.
Fig. 10 Grid cell mean (n = 39) monthly water balances for AR and VR soil types.
Table A1 WATBAL parameter values for each grid cell (see for location of study region in Sudan).