
Figures & data
Fig. 1 Location of the study area: the Hai River Basin (HRB; black solid line), the North China Plain (NCP; dark blue solid line) and administrative provinces (gray solid line). The geomorphological regions, surface water reservoirs, soil moisture stations and monitoring bores are also demonstrated. A hydrogeological profile for the location of the cross-section (black dotted line) is shown in .
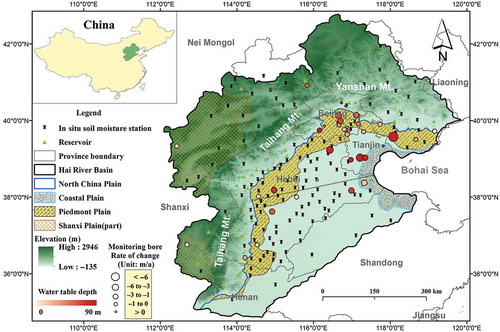
Fig. 2 Precipitation in the study area: (a) annual and 10-year average precipitation in the NCP from 1951 to 2012, and long-term average for 1951–2012 for both HRB and NCP; (b) deviation of annual precipitation for 2003–2012 from the long-term average (50 years: 1951–2001) over the NCP and HRB. Data from the Global Precipitation Climatology Centre (GPCC).
Fig. 3 Hydrogeological profile across the NCP. Adapted from Foster et al. (Citation2003) with permission. The location of the cross-section is shown in .
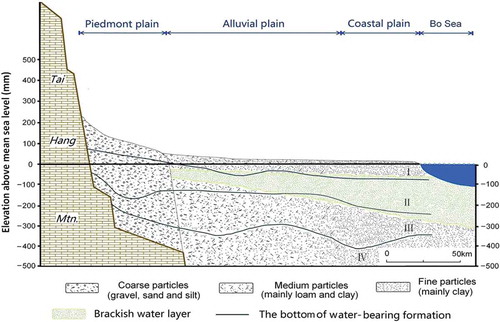
Table 1 Comparison of surface and groundwater use between HRB and NCP in 2003. Data are sourced from the Hai River Basin Water Resources Bulletin (Citation2003–2010) and Hai River Basin Groundwater Bulletin (Citation2010).
Fig. 4 Precipitation, in situ soil moisture(SM) and potential evaporation across the HRB: (a) monthly precipitation and in situ SM storage anomalies (expressed as deviation from the mean of 2003–2012); and (b) mean monthly precipitation (2003–2012), pan evaporation (1971–2000) and mean monthly in situ SM storage anomalies. The error range of SM anomalies is indicated by light grey shading. Precipitation data are from the GPCC, and pan evaporation and in situ soil moisture data are from the Chinese Meteorological Data Sharing Service (CMDSS).
Table 2 Linear trends in water storage for terrestrial water storage anomalies (TWS), in situ soil moisture anomalies (SM), deep sub-surface water storage anomalies (DSS) and in situ groundwater anomalies (in situ GW), 2003–2012.
Fig. 5 (a) and (b) total water storage anomalies (TWS: —) and deep subsurface water storage anomalies (DSS: ······) derived from GRACE GRGS_RL02 over the HRB from 2003 to 2012; (c) in situ groundwater storage anomalies (in situ GW: - - - -) over the HRB for the same period; and (d) seasonal amplitudes in TWS, SM, DSS and in situ GW after removing annual trend. The legends for TWS, DSS and in situ GW are kept in the same pattern as in (a), (b) and (c), except for SM (-·-·-). Linear trend for TWS, DSS and in situ GW: ![]()
Fig. 6 (a) and (b) total water storage anomalies (TWS: —) and deep subsurface water storage anomalies (DSS: ······) derived from GRACE CSR_RL05 over the HRB from 2003 to 2012; (c) in situ groundwater storage anomalies (in situ GW: - - - -) over the HRB for the same period; (d) seasonal amplitudes in TWS, SM, DSS and in situ GW after removing annual trend. The legends for TWS, DSS and in situ GW are kept in the same pattern as in (a), (b) and (c), except for SM(-·-·-). Linear trend for TWS, DSS and in situ GW: ![]()
Table 3 Evolution of water resources consumption by different sectors. Data source: Hai River Water Conservancy Commission (http://www.hwcc.gov.cn).