Figures & data
Fig. 1 The Aksu basin, its three main hydrological gauge stations: S1: Xiehela, S2: Shaliguilanke and S3: Xidaquiao, and the corresponding sub-catchment boundaries.
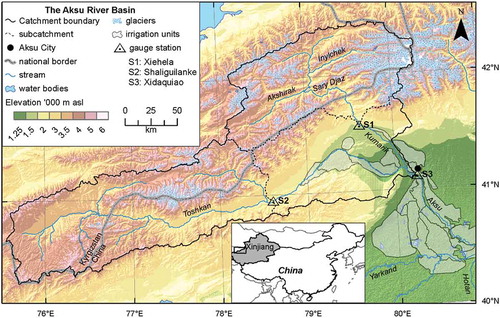
Fig. 2 Location of climate stations and grid points of interpolated CMA data, WATCH and APHRODITE data for the Aksu basin: the numbers of grid cells were created during the interpolation process.
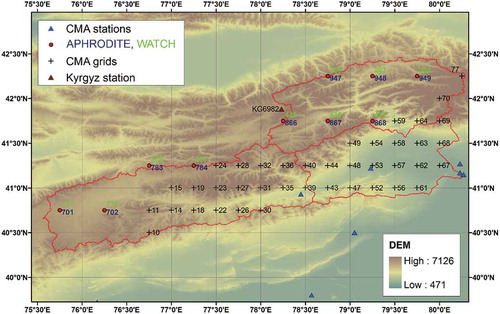
Table 1 General characteristics of three sub-areas S1, S2 and S3 of the Aksu basin. The minimum value in the altitude range is the station elevation.
Fig. 3 Elevation and glacier cover distribution in the Aksu basin.
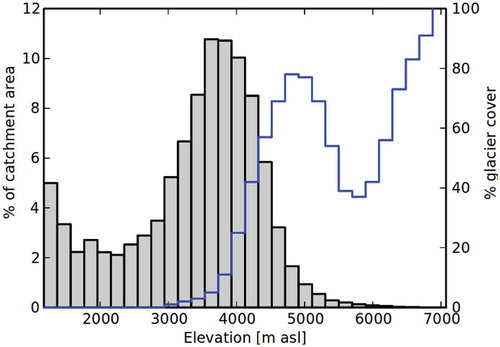
Fig. 4 Statistical significance of positive trends in temperature (top) and of positive and negative trends in precipitation (bottom) in the Aksu basin according to the Mann-Kendall test for the period 1961–2001: the numbers of grid cells were created during the interpolation process.
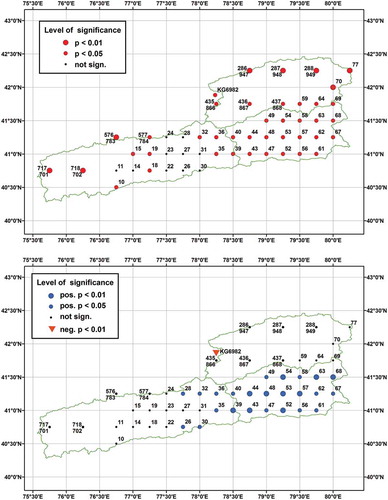
Fig. 5 Annual average temperature and 7-year moving averages for grid points: 15, 27, 53, 70, 718 and 287. From these examples only one point (27) did not show significant positive trend.
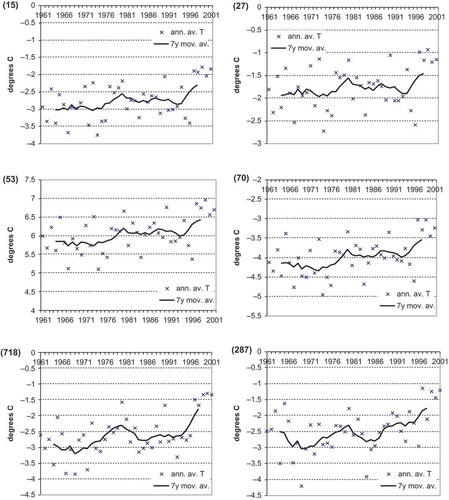
Fig. 6 Annual average precipitation and 7-year moving averages for grid points: 15, 27, 53, 70, 702 and 948. From these examples only one point (53) shows significant trend estimated by both methods, and three points (15, 702, 948) do not show statistically significant trends.
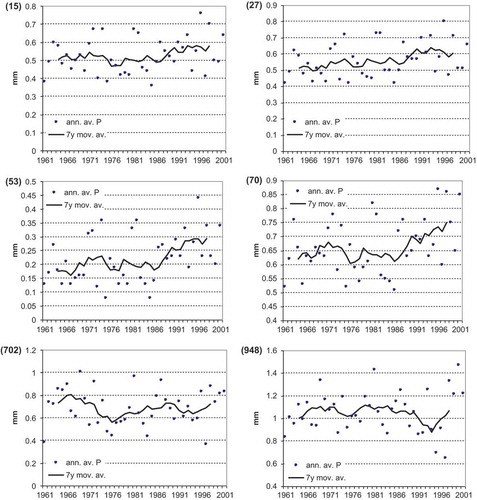
Table 2 Significance of annual, seasonal and monthly trends in water discharge for gauging stations Xiehela (S1), Shaliguilanke (S2) and Xidaquiao (S3) for the period 1957–2004 (MK p: p value for the Mann-Kendall test, LM p: p value for the linear model test).
Fig. 7 Seasonal trends in water discharge for the gauging stations Xiehela (S1) and Shaliguilanke (S2) for the period 1957–2004.
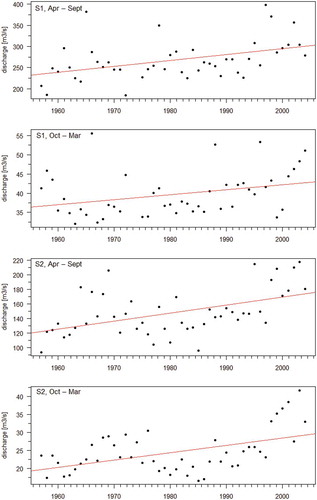
Table 3 Comparison of average monthly and average annual discharges at the two upstream gauges Shaliguilanke and Xiehela and the downstream gauge Xidaqiao for the period 1997 to 2004. Deviation means difference between the value for Xidaquiao and the sum of discharges at two tributaries divided by the sum of discharges at two tributaries.
Fig. 8 Observed dynamics of (a) average temperature, average precipitation and river discharge from the 1st of May until end of November in 1965 for the Xiehela gauge station, and (b) time series of temperature and water discharge for this station for the period 17.6.1965–26.8.1965.
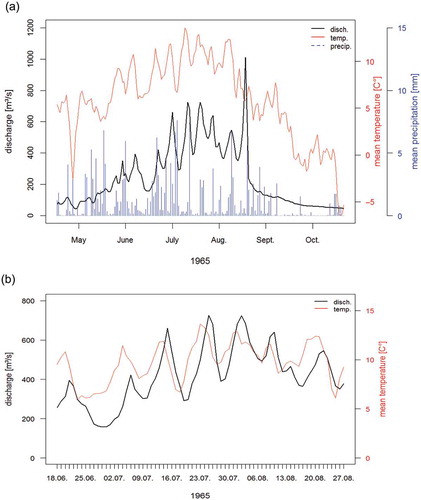
Table 4 Correlation coefficients between temperature and water discharge based on the Spearman method for summer periods (see text for explanation) in the period 1965–1987, with 0, 1, 2 and 3 days delay. All entries are significant at the level 0.001 indicated by***.
Table 5 Correlation between temperature and water discharge based on the Spearman method for short periods in late summer/autumn in 1965–1987; level of significance: * 0.05, ** 0.01,*** 0.001.
Fig. 9 Scatter plots of average sub-catchment temperature and river discharge at the Xiehela gauge station for the summer period of 1965 with 0, 1, 2 and 3 d delays, and the corresponding Spearman correlation coefficients.
Fig. 10 Scatter plots of average sub-catchment temperature and river discharge at the Xiehela gauge station for the summer periods of four selected years with 2 d delay.
Table 6 Xiehela: highest annual peak discharge (peak and end of receding limb dates) in the period 1964–1987 and the corresponding dates of GLOF at Inylchek recorded by Glazirin (Citation2010). Reported dates are subject to high uncertainty due to arbitrary and partly false reporting. See text for more explanation.
Fig. 11 River discharge at the Xiehela and Inylchek Mouth gauging stations from May until November for selected years (no data available for Inylchek in 1985). Dates of GLOFs with ±5 d uncertainty bands (dashed line, grey bands) as reported by Glazirin (Citation2010) and peak discharges at Xiehela (annotated) are given.
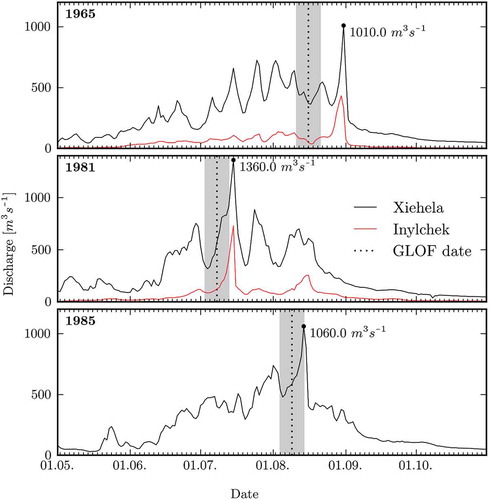
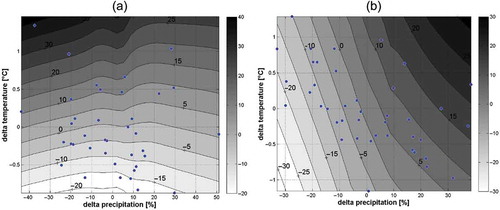
Fig. 12 Contour plot of percentage runoff change during the warm season (April–September) as a function of percentage precipitation and temperature change in the same season for (a) Xiehela and (b) Shaliguilanke. Points show observations.