Figures & data
Figure 1. Location of the watersheds under study. Discharge stations: 1—Diguillín at San Lorenzo and 4—Renegado at Invernada. Precipitation stations: 2—Fundo Atacalco and 3—Diguillín.
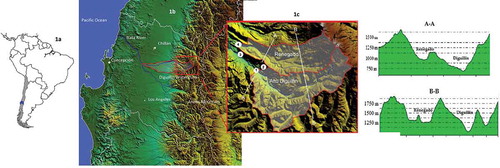
Figure 2. (a) Specific discharge (Qs) for the Upper Diguillín River (•) and Renegado Creek (∘); and (b) relationship between discharges (QsDiguillín/QsRenegado).
Figure 3. (a) Conceptual model of aquifer configuration and flow from the aquifer to the river; (b) and (c) distribution of the transverse profiles considered to estimate aquifer depth in the Upper Diguillín River and Renegado Creek, respectively.
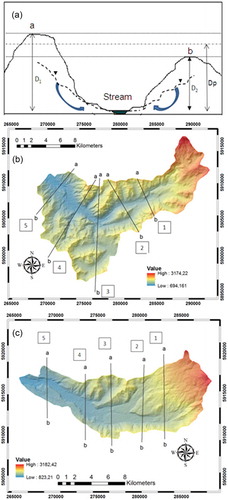
Figure 4. Scatter plot of total precipitation, P (mm) and average discharge, Qa (m3 s-1) for the Upper Diguillín River and Renegado Creek basins (annual and seasonal figures), along with Lowess curves.
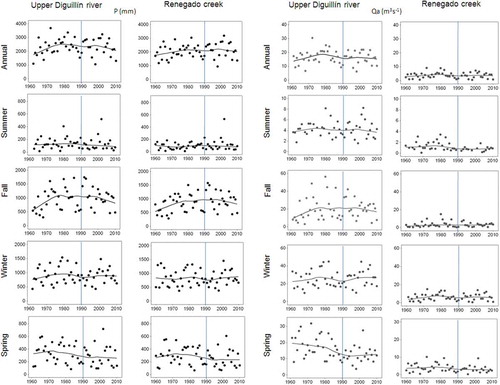
Table 1. Sen’s slopes for precipitation (P, in mm year-1) and discharge (Q, in m3 s-1 year-1) in the Upper Diguillín and Renegado Creek sub-basins. Bold font denotes statistically significant slopes (α = 0.05).
Figure 5. Recession flow data for the (a) Upper Diguillín and (b) Renegado Creek basins. Open circles correspond to the average for each flow interval (see text), with the solid line representing the corresponding linear regression; dashed lines represent the b = 3 and b = 3/2 lower envelopes and the 1:1 upper envelope (see legend); and the vertical solid line is placed for the maximum log(Q). The transition points (1, 2, 3) are also indicated.
Table 2. Summary of hydrogeological parameter estimation (bold font denotes values obtained for D = 0.1 Dp).
Figure 6. Point cloud of specific streamflows (y) vs temporal variation of specific streamflows (–dy/dt) for the (a) Upper Diguillín and (b) Renegado Creek basins (where y = Q/A is in mm d-1).
Table 3. dyL7/dt (mm d-1 year-1) and dS/dt (mm year-1) in the studied basins (* indicates a slope of the regression equation distinct from 0, for a significance level of 5% based on Student’s t-test, while + indicates trends at the same significance level using the Mann-Kendall statistic).
Figure 7. Evolution of lowest 7-day specific streamflows (yL7 = QL7/A, in mm d-1) for the (a) Upper Diguillín and (b) Renegado Creek basins.
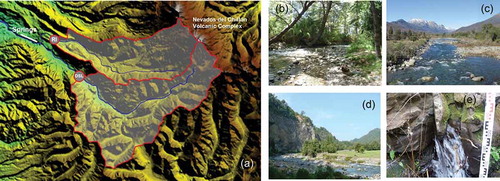
Figure 8. (a) Location and landscape characteristics of springs that flow into the Diguillín River; (b) Renegado Creek; (c) Diguillín River; (d) cliffs where springs flow into the Diguillin River; and (e) fractured rock spring at the base of the cliff.