
Figures & data
Fig. 1 The validation sites: Landriano (Italy; 0.01 km2) and Barrax (Spain; 12 km2) (from Google Images) and the Upper Po River basin (Italy; about 38 000 km2) from a MODIS RGB image.
Fig. 2 Field-scale comparison between simulated RET and LST (°C) measured at the station and retrieved from MODIS. The regression equation and R2 are reported.
Table 1 Field-scale statistical parameters between RET (°C) and LST (°C) from the ground radiometer and from MODIS (Std Dev: standard deviation).
Fig. 3 Field-scale comparison between simulated and observed SM (-) from 14 July to 2 October 2006.
Fig. 4 Agricultural district-scale values of RET (°C) and LST (°C) from AHS and their difference (RST – LST; °C), and SM (-) from FEST-EWB for 13 July 2005 at 13:45: maps and histograms.
Fig. 5 Agricultural district-scale spatial autocorrelation functions (AC) for RET (°C) and LST (°C) from AHS and SM (-) from FEST-EWB for 13 July 2005 at 13:45.
Fig. 6 Agricultural district-scale statistics for comparison between RET (°C) and LST (°C) from AHS for the 12 available images: (a) MBE, (b) RMSE, (c) RE and (d) η.
Table 2 Agricultural district-scale statistical parameters between RET (°C) and LST (°C) from AHS for the 12 available images. MBE and Std Dev (°C), RMSE (°C), RE (%) and η are computed considering the total database, diurnal and nocturnal data, bare soil and vegetated fields.
Fig. 7 Basin-scale images comparing RET (°C) and LST (°C) from MODIS for selected images for 2003.
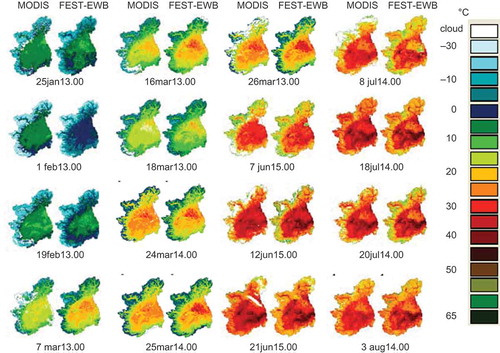
Fig. 8 Basin-scale histograms comparing RET (°C) and LST (°C) from MODIS for 25 January at 13:00, 16 March at 13:00 and 7 June at 15:00, in 2003.
Fig. 9 Basin-scale autocorrelation functions (AC) for RET (°C) and LST (°C) from MODIS, and SM (-) from FEST-EWB for 25 January at 13:00, 16 March at 13:00 and 7 June at 15:00, in 2003.
Fig. 10 Basin-scale statistical parameters for comparison between RET (°C) and LST (°C) from MODIS for the 130 selected images: (a) MBE, (b) RMSE, (c) RE and (d) η.
Table 3 Basin-scale statistical parameters between RET (°C) and LST (°C) from MODIS for the 130 selected images. MBE and Std Dev (°C), RMSE (°C), RE (%) and η are computed considering the total database, diurnal and nocturnal data, and according to vegetation types coverage.