Figures & data
Fig. 1 Location of the study area, surrounding rivers and monitoring stations in and around Lake Taihu, China. Water level monitoring stations (1)–(4) represent Dapukou, Jiapu, Xiaomeikou and Xishan, respectively.
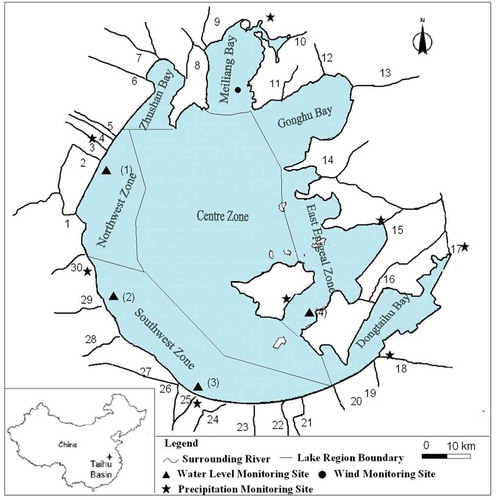
Fig. 2 Methodology flowchart.
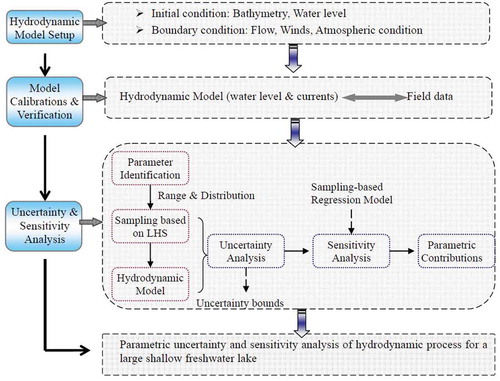
Table 1 Statistical features of the hydrodynamic parameters used for the Latin hypercube sampling method.
Fig. 3 (a) Mean, (b) 5th percentile, (c) 95th percentile and (d) variance of simulated water level with uniform distributions.
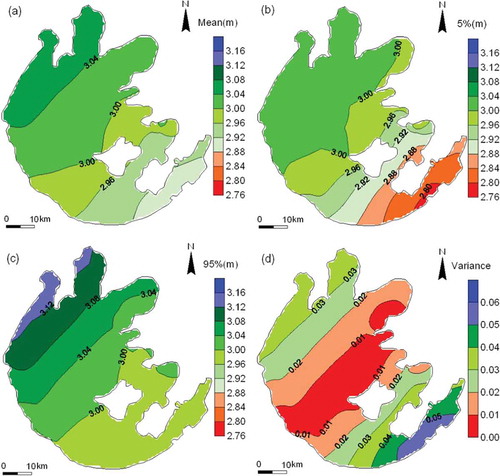
Fig. 4 (a) Mean, (b) 5th percentile, (c) 95th percentile and (d) variance of simulated flow velocity at the surface layer with uniform distributions.
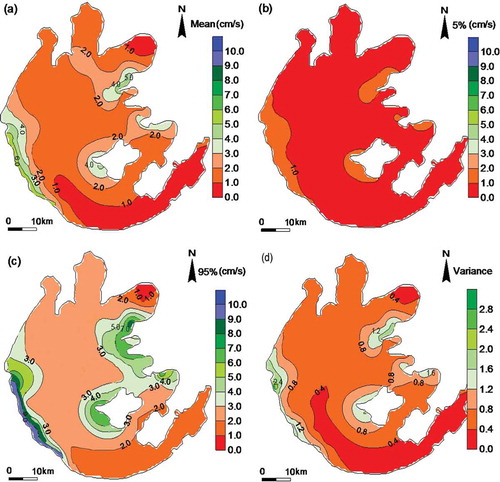
Fig. 5 Mean and variance of simulated flow velocity: (a) and (b) at the middle layer, and (c) and (d) at the bottom layer.
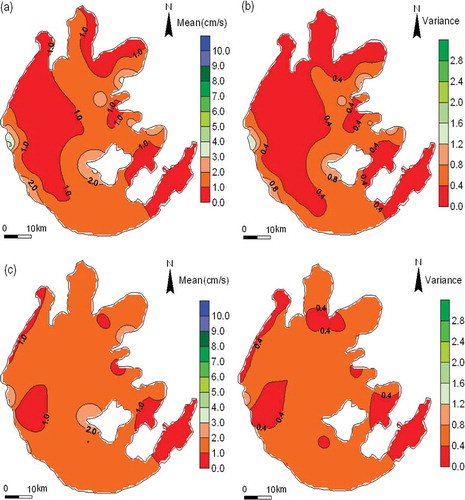
Table 2 Sensitivity assessment for parameters with different distributions.
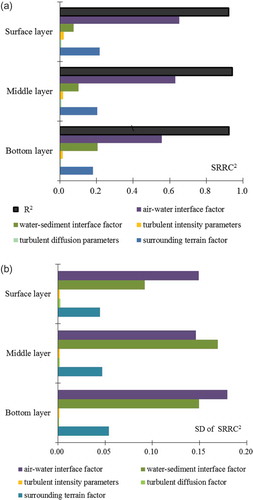
Fig. 6 Mean and standard deviation (SD) of standardized regression coefficient (SRRC2) of the five parameters for flow velocity uncertainty at different vertical layers with a uniform distribution.