
Figures & data
Figure 1. Location of the three rainfall observation sites in Sweden: (A) Malmö, (B) Norrköping, and (C) Petisträsk.
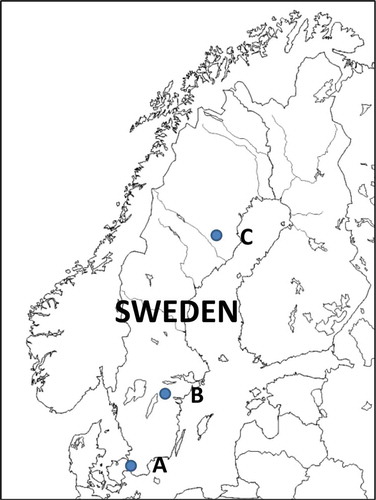
Table 1. Soil properties, soil texture according to FAO (Citation2006).
Table 2. Parameters describing the rainfall properties.
Figure 2. Data from Malmö, Soil 1. Top pane precipitation, middle zcom considering hysteresis, and bottom zcom without considering hysteresis with a 0.5-h input time step.
Table 3. Mean zCOM (m) for the simulation period at all sites and soil types.
Table 4. Mean zLC (m) for the simulation period at all sites and soil types.
Table 5. Correlation coefficients between rainfall dynamic parameters and zCOM/Ptot for hysteretic flow. Values in italics are significant at the p = 0.05 level, values in bold are significant at the p = 0.01 level.
Table 6. Correlation coefficients between rainfall dynamic parameters and zCOM/Ptot for non-hysteretic flow. Values in italics are significant at the p = 0.05 level, values in bold are significant at the p = 0.01 level.
Table 7. Correlation coefficients between rainfall dynamic parameters and zLC/Ptot for hysteretic flow. Values in italics are significant at the p = 0.05 level, values in bold are significant at the p = 0.01 level.
Table 8. Correlation coefficients between rainfall dynamic parameters and zLC/Ptot for non-hysteretic flow. Values in italics are significant at the p = 0.05 level, values in bold are significant at the p = 0.01 level.