
Figures & data
Figure 1. Location map of the study region.
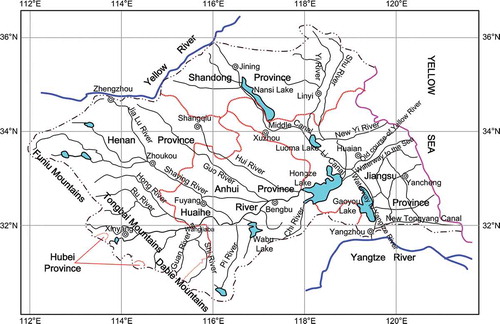
Figure 2. Percent of river length for various water-quality grades of the Huaihe River basin.
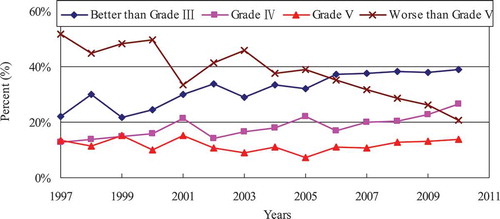
Figure 3. Sketch of the water-resource calculation node.
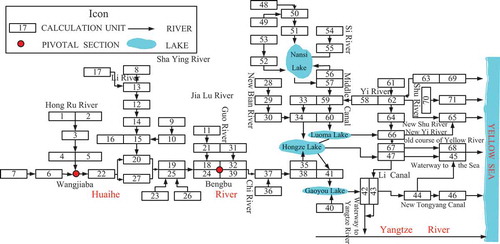
Figure 4. Forecasted results of the parameters of socio-economic development level: (a) GDP per capita; (b) electricity generation per capita; (c) grain yield per hectare; and (d) livestock rearing per capita.
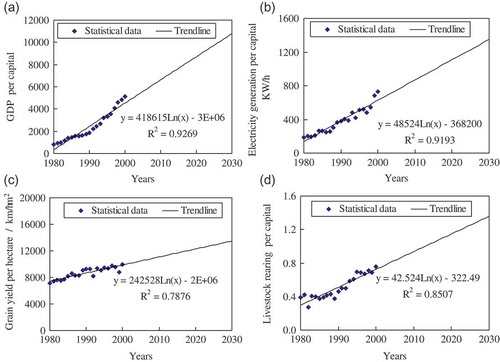
Figure 5. Linking relationship of the three sub-models.
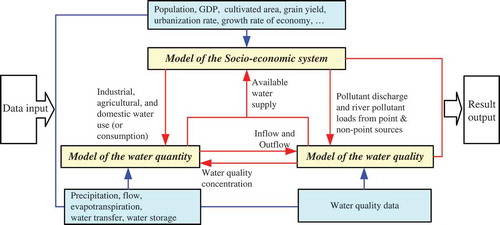
Figure 6. Simulation results for water quantity: (a) flow at the Wangjiaba Hydro-junction cross-section, and (b) flow at the Bengbu Sluice cross-section.
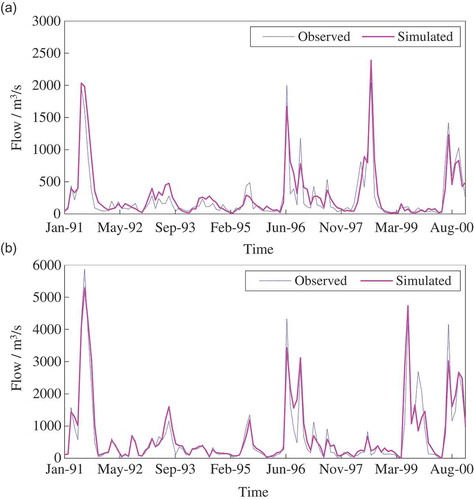
Figure 7. Simulation results for water quality: (a) CODMn concentration at the Wangjiaba Hydro-junction cross-section, and (b) CODMn concentration at the Bengbu Sluice cross-section.
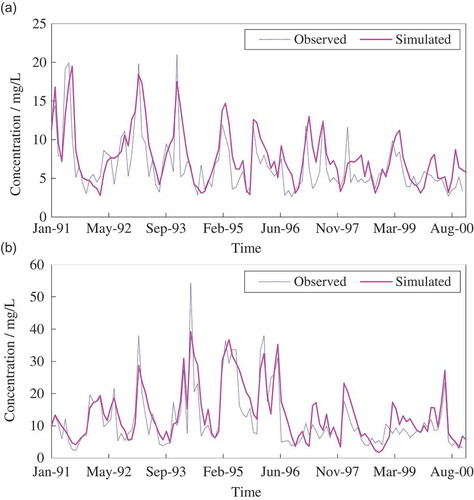
Table 1. Calculation conditions of the OCM model.
Table 2. Comparison of actual/forecasted and sustainable socio-economic scale of the Huaihe River basin.
Table 3. Schemes for enhancing the sustainable scale.
Table 4. Sustainable and overloaded socio-economic scales for each scheme.
Figure 8. Comparison between the population and GDP in the schemes and planning mode.
Table 5 Characteristic values of the parameters in Scheme 8.