
Figures & data
Figure 1. Map of the High Plains aquifer in the US and Kansas (inset). Kansas inset also shows groundwater management district (GMD – colored lines) and climatic division (dashed) boundaries (modified from Butler et al. Citation2013).
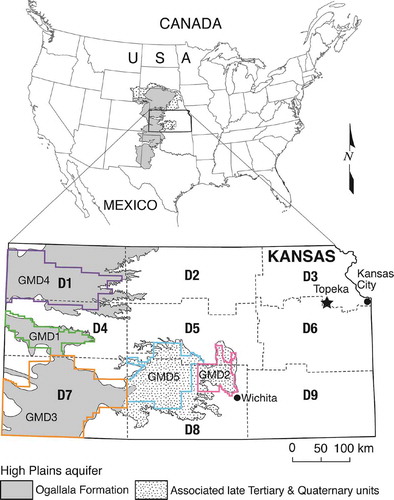
Figure 2. (a) Mean annual water-level changes (solid lines) in the HPA in the GMD areas and SPI 9-month October (GMDs 4, 1, and 3) and 12-month December (GMDs 2&5) values (dashed lines) during 1996–2012. See for the locations of the climatic divisions and GMDs. The y-axis ranges vary among plots to accentuate the relationship between fluctuations in water-level change (left y-axis) and those in the SPI (right y-axis). Water-level data are from wells for which measurements are available throughout 1996–2013 (188, 60, 222, and 233 wells for GMDs 4, 1, 3, and 2&5, respectively). A value for a particular year represents the water-level difference between that year and the following year for a given well; the mean annual change is an unweighted arithmetic average of the values for all the wells. A SPI value of zero indicates average (historic norm) conditions, values <0 and >0 indicate dry and wet conditions, respectively. (b) Correlation plots for data displayed in (a). See for coefficients of determination and regression equations. The point within the circle in (b) is the outlier referred to in the text.
Figure 3. (a) Mean annual water-level changes (solid lines) and reported water use (dashed lines) for the HPA in the GMD areas during 1996–2012. See for the locations of the climatic divisions and GMDs; the y-axis ranges vary among plots to accentuate the relationship between fluctuations in water-level change (left y-axis) and those in water use (right y-axis). The water-level data are the same as shown in . (b) Correlation plots for data displayed in (a). See for coefficients of determination and regression equations. The point within the circle in (b) is the outlier referred to in the text.
Table 1. Optimuma and utilizedb (bolded) correlations of mean annual water-level changes for GMDs with climatic indices for coinciding climatic divisions during 1996–2012.
Table 2. Coefficients of determination (R2) and linear regression equations for correlation of mean annual water-level changes with reported water use during 1996–2012 for the GMD areasa.
Figure 4. (a) SPI 9-month October (GMDs 4, 1, and 3) and 12-month December (GMDs 2&5) values (solid lines) and reported water use (dashed lines) for the HPA in the GMD areas during 1996–2012. See for the locations of the climatic divisions and GMDs; the y-axis ranges vary among plots to accentuate the relationship between fluctuations in SPI (left y-axis) and those in water use (right y-axis). The SPI data are the same as shown in and the water use data the same as in . (b) Correlation plots and R2 values for data displayed in (a).
Table 3. SPI values for given year and predicted water-level declines calculated using the regression equations in for a drought of the same length and intensity of that of the 1950s.
Table 4. Steps for calculating pumping reduction to obtain stable water levels (water-level change of zero) for GMD4 and GMDs 2&5 during 1996–2012 using water-level and water-use regression equations in .
Table 5. Steps for calculating average annual water-level decline for 21.7% reduction in pumping in GMD1 based on SPI change for this reduction in GMD4 for 1996–2012.