
Figures & data
Fig. 1 (a) Location of the study area within the provinces Jiangxi (J) and Anhui (A) in southeastern China; (b) location of the three climate stations (1: Anqing, 2: Jingdezhen, 3: Meilin/Tunxi), and (c) topography (DEM: 90 m SRTM, Jarvis et al. Citation2008) and river network in the Changjiang River basin, sampling sites (i.e. sub-basin outlets) and the Tankou gauge at the outlet.
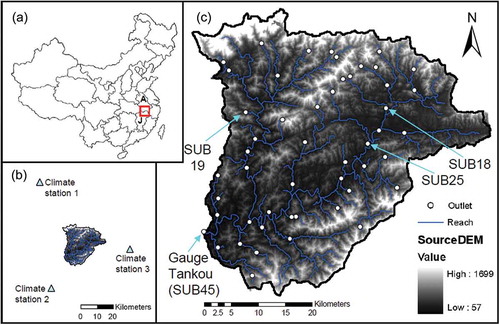
Table 1 Relative land-use cover in the Changjiang catchment (using a supervised multispectral classification approach based on Landsat TM data of the year 2006; Schmalz et al. Citation2012).
Table 2 Data input necessary to depict water and sediment fluxes in the basin.
Table 3 Variables used for the calibration of streamflow at Tankou gauging station and their initial and final values. ‘Fixed’ means to have set a fixed value according to literature research or expert knowledge, ‘calculated’ variables are explained with the corresponding procedure in the text, ‘calibrated’ means that the variable was calibrated by manual adjustment and using SWAT-CUP (see text).
Table 4 Variables used for the parameterization of sediment and their initial and final values.
Table 5 Studies analysing surface runoff depending on land use.
Table 6 Studies analysing the spatial distribution of sediment yield between sub-basins. See Fig. 2 for catchment locations.
Table 7 Studies analysing the influence of land use on the spatial distribution of sediment yields. See Fig. 2 for catchment locations.
Fig. 2 Locations of study areas used for validating sediment model results. Numbers are related to and (missing numbers: 3: Upper Yangtze basin, 8: entire Yangtze basin, 12: southern China, 14: Korean area, 16: area in Sri Lanka, 20: mountainous woodlands). Black circle represents location of study area.
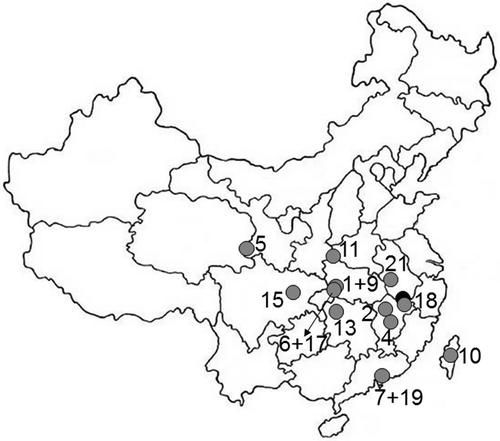
Table 8 Model performance for daily and monthly streamflow during calibration and validation periods.
Fig. 3 Precipitation, and hydrograph of observed and simulated daily streamflow at Tankou station during the calibration period (2001–2010) (CMA Citation2011; Jiangxi Hydrological Bureau Citation2011).
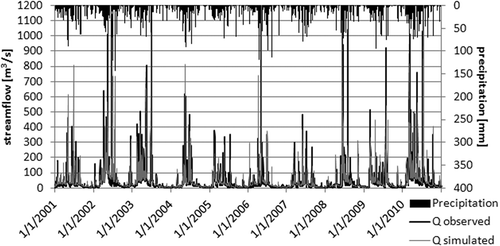
Table 9 Correlation (r2) between measured precipitation (PCP) and measured streamflow (Q) for the entire simulation period 1986–2010 on daily and monthly basis.
Fig. 4 Flow components within the sub-basin at the basin outlet (site SUB45): values averaged over 10 years (2001–2010, calibration period). Note SUR_Q, surface runoff; LAT_Q, lateral flow; GW_Q, groundwater flow.
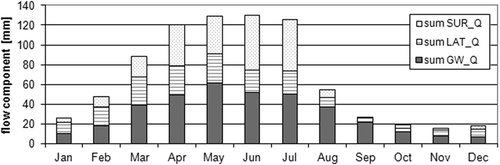
Table 10 Simulated surface runoff (SURQ; average annual values, 2001–2010) (left) for the entire basin depending on land use (LU) and (right) in HRUs of two example sub-basins with different land use and the same soil (LU-Soil). n is the number of HRUs within the selected sub-basin.
Fig. 5 Flow components—GWQ: groundwater flow; LatQ: lateral flow; SurQ: surface runoff—within all sub-basins, represented as pies (%), as well as sediment yield, SYLD (t ha-1), represented as background colour of sub-basins. Annual values averaged over 10 years (2001–2010, calibration period).
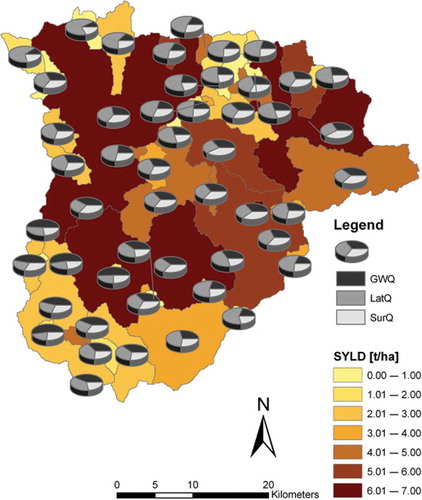
Table 11 Measured total suspended solids (TSS) at 12 detailed sites in two field campaigns in October 2010 and February/March 2011.
Fig. 6 Daily dynamics of the simulated sediment yield within the sub-basin at the basin outlet (SUB45) over 10 years (2001–2010, calibration period), as well as precipitation (CMA 2011). See Fig. 2 for catchment locations.
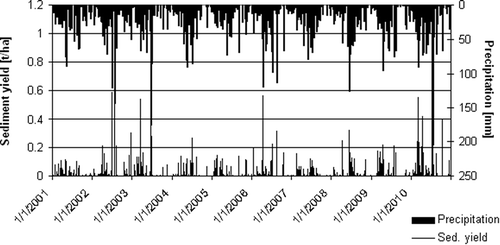
Fig. 7 Seasonal dynamics of the simulated sediment yield within the sub-basin at the basin outlet (site SUB45): values are the monthly sum of sediment yield averaged over 10 years (2001–2010, calibration period). See Fig. 2 for catchment locations.
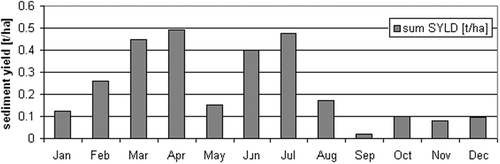
Table 12 Simulated sediment yield (SYLD; average annual values, 2001–2010) (left) for the entire basin depending on land use (LU) and (right) in HRUs of two example sub-basins with different land use and same soil (LU-Soil). n is the number of HRUs within the selected sub-basin.