1,689
Views
14
CrossRef citations to date
0
Altmetric
Special issue: Evaluation of Water Resources with SWAT

Assessment of climate change impacts on water quantity and quality of the multi-river Vistula Lagoon catchment

Evaluation des impacts du changement climatique sur la qualité et la quantité des eaux du delta de la Vistule

, , , &
Pages 890-911 | Received 06 Dec 2013, Accepted 10 Jun 2014, Published online: 07 Apr 2015

Figures & data

Table 1 GCM/RCM combination matrix of the climate scenarios used in this study for climate impact assessment.

Fig. 1 Overview map of the Vistula Lagoon catchment showing the digital elevation model (DEM), national borders, major sub-catchments (numbered), main river courses, discharge gauges with available data, as well as the grid points of WATCH climate data.
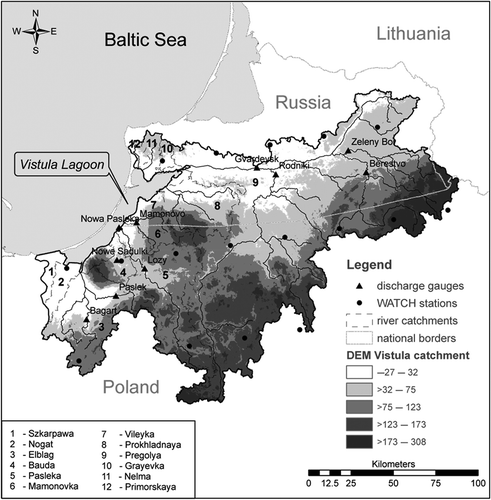
Fig. 1 Overview map of the Vistula Lagoon catchment showing the digital elevation model (DEM), national borders, major sub-catchments (numbered), main river courses, discharge gauges with available data, as well as the grid points of WATCH climate data.

Table 2 Total amounts of point-source nutrient inputs and fertilization rates implemented in the model.

Fig. 2 Performance of SWIM calculated for the total period and distinguished into calibration/validation periods for the two main rivers flowing to the Vistula Lagoon: Comparison of simulated and observed discharges as daily (left) and long-term average daily (right) dynamics for the Pasleka and Pregolya rivers.
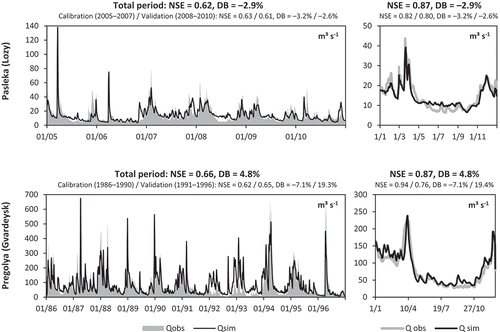
Fig. 2 Performance of SWIM calculated for the total period and distinguished into calibration/validation periods for the two main rivers flowing to the Vistula Lagoon: Comparison of simulated and observed discharges as daily (left) and long-term average daily (right) dynamics for the Pasleka and Pregolya rivers.

Table 3 Model performances at 10 discharge gauges located within the Vistula Lagoon catchment achieved by using the SWIM model covering the entire drainage area with a common parameter set.

Fig. 3 Comparison of the observed (general mean discharge values found in literature, grey) and simulated (average values obtained with SWIM for 1980–2009, white) water inputs to the Vistula Lagoon per river and in total.

Fig. 3 Comparison of the observed (general mean discharge values found in literature, grey) and simulated (average values obtained with SWIM for 1980–2009, white) water inputs to the Vistula Lagoon per river and in total.

Fig. 4 Observed (obs) and simulated (sim) water quality variables for the Pasleka River (gauge Nowa Pasleka): monthly averages (left) and long-term average seasonal dynamics (right) of nitrate nitrogen (NO3-N), ammonium nitrogen (NH4-N), phosphate phosphorus (PO4-P), and dissolved oxygen (DO) concentrations, as well as water temperature for the period 2005–2009; the long-term average seasonal nutrient dynamics could be also compared with the SWIM simulated average monthly discharge (Qsim) at the same gauge.
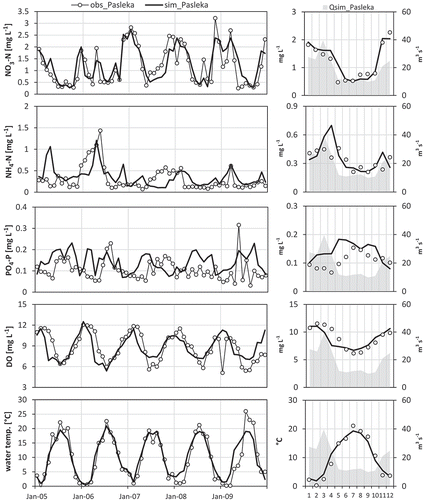
Fig. 4 Observed (obs) and simulated (sim) water quality variables for the Pasleka River (gauge Nowa Pasleka): monthly averages (left) and long-term average seasonal dynamics (right) of nitrate nitrogen (NO3-N), ammonium nitrogen (NH4-N), phosphate phosphorus (PO4-P), and dissolved oxygen (DO) concentrations, as well as water temperature for the period 2005–2009; the long-term average seasonal nutrient dynamics could be also compared with the SWIM simulated average monthly discharge (Qsim) at the same gauge.

Table 4 Spatial validation of water quality variables for nine rivers flowing into the Vistula Lagoon: comparison of the average of all available observed nutrient and dissolved oxygen (DO) concentrations with the average of the corresponding simulated values for the period 1998–2000 and some additional sub-periods in 1980–2009.

Table 5 Average daily nutrient loads of the 12 largest rivers entering Vistula Lagoon, as simulated with SWIM for the calibration/validation period 1980–2009.

Table 6 Annual climate change signals for the Vistula Lagoon catchment as the average of all 15 ENSEMBLES scenarios.

Fig. 5 Climate change signals for all 15 ENSEMBLES scenarios and on average calculated as the differences between the average annual precipitation and temperature, respectively, of the three future periods (p1, p2, p3) to the average annual values of the reference period (p0) of the same scenario.
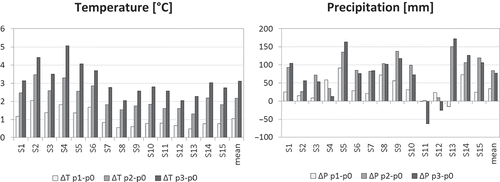
Fig. 5 Climate change signals for all 15 ENSEMBLES scenarios and on average calculated as the differences between the average annual precipitation and temperature, respectively, of the three future periods (p1, p2, p3) to the average annual values of the reference period (p0) of the same scenario.

Fig. 6 Dynamics of total water inflow to the Vistula Lagoon averaged for simulations driven by 15 ENSEMBLES climate scenarios: (left) long-term average daily discharges with percentile bands simulated in future periods compared to the long-term average daily discharge simulated in the reference period driven by simulated climate; and (right) absolute difference in monthly average discharges of three future periods compared to those simulated in the reference period 1971–2000. See text for explanation.
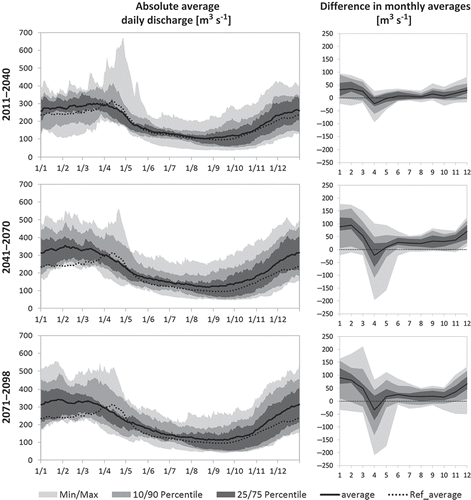
Fig. 6 Dynamics of total water inflow to the Vistula Lagoon averaged for simulations driven by 15 ENSEMBLES climate scenarios: (left) long-term average daily discharges with percentile bands simulated in future periods compared to the long-term average daily discharge simulated in the reference period driven by simulated climate; and (right) absolute difference in monthly average discharges of three future periods compared to those simulated in the reference period 1971–2000. See text for explanation.

Fig. 7 Impact of ENSEMBLES climate change scenarios on water quality parameters and nutrient loads coming into the Vistula Lagoon: average absolute changes in seasonal dynamics of water temperature (Twat), dissolved oxygen (DO), nitrate nitrogen (NO3-N), ammonium nitrogen (NH4-N) and phosphate phosphorus (PO4-P) calculated as the difference between SWIM-simulated mean monthly nutrient outputs under future climate conditions compared to results achieved under the simulated climate in the reference period.
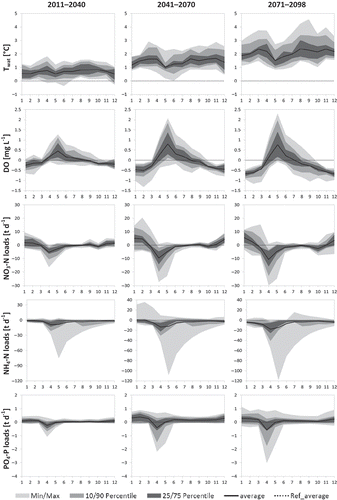
Fig. 7 Impact of ENSEMBLES climate change scenarios on water quality parameters and nutrient loads coming into the Vistula Lagoon: average absolute changes in seasonal dynamics of water temperature (Twat), dissolved oxygen (DO), nitrate nitrogen (NO3-N), ammonium nitrogen (NH4-N) and phosphate phosphorus (PO4-P) calculated as the difference between SWIM-simulated mean monthly nutrient outputs under future climate conditions compared to results achieved under the simulated climate in the reference period.

Fig. 8 Ranges of percentage changes of total discharge and nutrient inputs to the Vistula Lagoon as well as of average water temperatures and dissolved oxygen concentrations simulated with SWIM driven by 15 ENSEMBLES climate scenarios (future periods (p1, p2, p3) compared to reference period (p0) of the same scenario). The box plots visualize the following ranges: min/max, 25/75-percentile, median and average (dots).
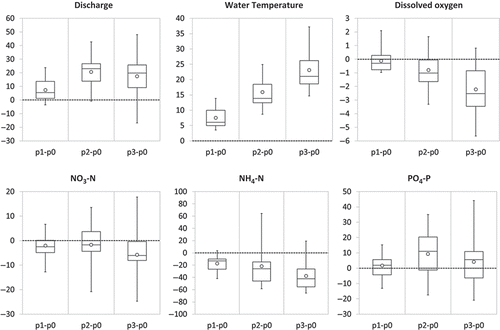
Fig. 8 Ranges of percentage changes of total discharge and nutrient inputs to the Vistula Lagoon as well as of average water temperatures and dissolved oxygen concentrations simulated with SWIM driven by 15 ENSEMBLES climate scenarios (future periods (p1, p2, p3) compared to reference period (p0) of the same scenario). The box plots visualize the following ranges: min/max, 25/75-percentile, median and average (dots).

Fig. 9 Spatial variability of projected climate change impacts on water discharge (Q), nitrate nitrogen loads (NO3-N), ammonium nitrogen loads (NH4-N), and phosphate phosphorus loads (PO4-P) for the mid-term scenario period 2041–2070. Compared are the reference and future average model outputs of the 12 main rivers draining to Vistula Lagoon per ENSEMBLE scenario S1–S15. The graphs show the average, minimum, and maximum changes of 15 scenarios in percentage terms as well as the 25- and 75-percentiles.
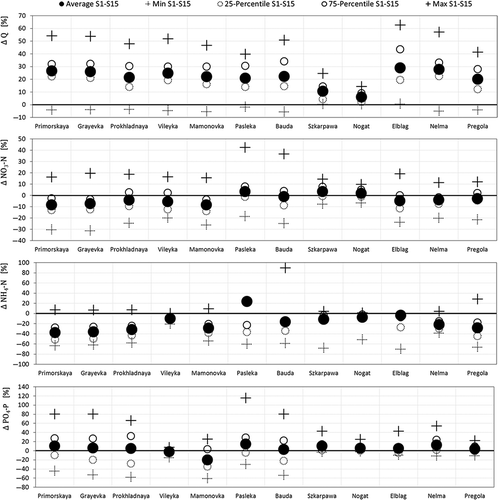
Fig. 9 Spatial variability of projected climate change impacts on water discharge (Q), nitrate nitrogen loads (NO3-N), ammonium nitrogen loads (NH4-N), and phosphate phosphorus loads (PO4-P) for the mid-term scenario period 2041–2070. Compared are the reference and future average model outputs of the 12 main rivers draining to Vistula Lagoon per ENSEMBLE scenario S1–S15. The graphs show the average, minimum, and maximum changes of 15 scenarios in percentage terms as well as the 25- and 75-percentiles.

Reprints and Corporate Permissions

Please note: Selecting permissions does not provide access to the full text of the article, please see our help page How do I view content?

To request a reprint or corporate permissions for this article, please click on the relevant link below:

Academic Permissions

Please note: Selecting permissions does not provide access to the full text of the article, please see our help page How do I view content?

Obtain permissions instantly via Rightslink by clicking on the button below:

If you are unable to obtain permissions via Rightslink, please complete and submit this Permissions form. For more information, please visit our Permissions help page.