
Figures & data
Figure 1. Study area and location of the selected watersheds. The watersheds and precipitation stations are numbered based on the first columns of and , respectively.
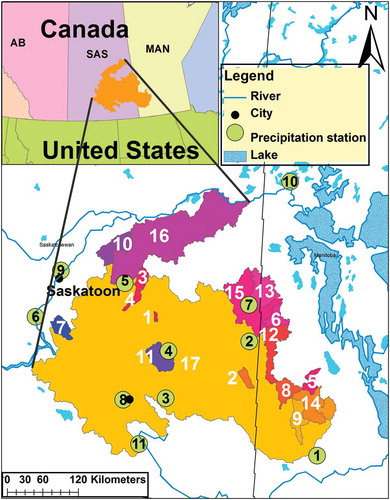
Table 1. Hydrophysical characteristics of the selected watersheds.
Figure 2. Number of remaining wetlands in a 44 wetland sample in the Carrot River watershed near Melfort during the 1962–2010 period.
Table 2. Precipitation stations used to estimate precipitation over the study area.
Table 3. Annual runoff ratio and effective drainage area ratio for the selected watersheds.
Figure 3. Relationship between effective drainage area ratio and runoff ratio.
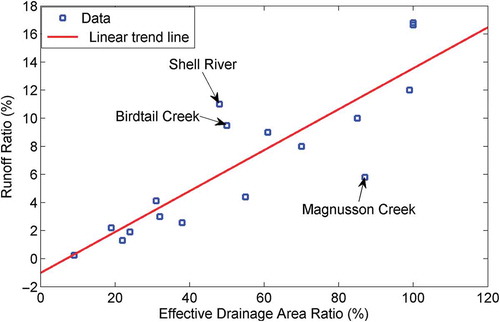
Table 4. Change point analysis results for different precipitation metrics. The numbers in the 4th and the 5th columns represent the timing (year) of detected shifts. Underlined years indicates an upward shift, the other years experienced downward shifts.
Table 5. Shift analysis results for runoff metrics. The numbers in the 4th to 6th columns represent the timing (year) of detected shifts. Underlined years indicate an upward shift.
Figure 4. Change point detection result for runoff ratio in Carrot River near Kinistino (05KA001).
Figure 5. Change point detection result for runoff ratio in Carrot River near Turnberry (05KH007).
Figure 6. Change point detection result for runoff ratio in Smith Creek near Marchwell (05ME007).
Figure 7. Trend analysis results for precipitation and runoff variables. Circles represent the location of precipitation stations and the corresponding colours indicate the direction of trends in the stations. The watersheds and precipitation stations are numbered based on the first columns of and , respectively.
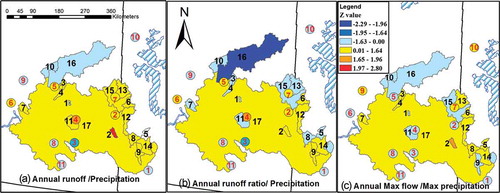
Table 6. Trend analysis results (Z values) for annual cumulative and maximum precipitation.
Table 7. Trend analysis results (Z values) for flow metrics.