
Figures & data
Figure 1. Model domain and topography used in this study. The regions designated as Guinea, Savanna and Sahel over West Africa are indicated. The Niger River Basin is shown with a blue line.

Figure 2. Observed (a, c) and simulated (b, d) rainfall (mm d-1) for January–March (a, b) and July–September (c, d). The Niger River Basin is shown with a blue line.
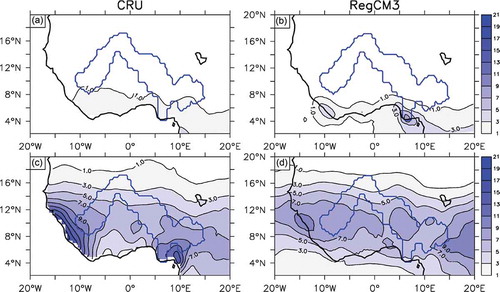
Figure 3. Observed (a, c) and simulated (b, d) evapotranspiration (mm d-1) for January–March (a, b) and July–September (c, d). The Niger River Basin is shown with a blue line.
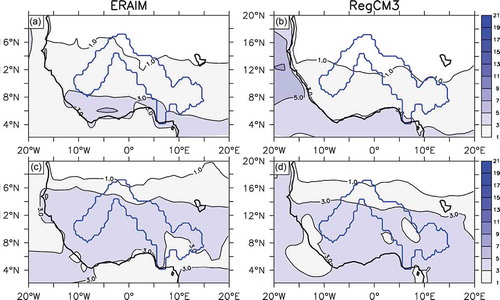
Figure 4. Observed (a, c) and simulated (b, d) temperature (°C) for January–March (a, b) and July–September (c, d). The Niger River Basin is shown by a blue line.
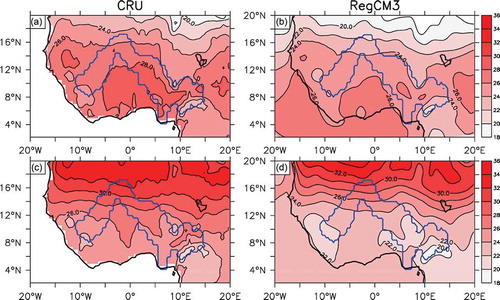
Table 1. Evaluation statistics for validating regional climate model (version 3, RegCM3) simulations with ERA-Interim reanalysis (ERAIM). Values shown in parentheses are for comparison with CRU (Climate Research Unit) data and river discharge in the case of runoff.
Figure 5. Simulated and observed annual cycle of (a) rainfall (mm d-1), (b) evapotranspiration (mm d-1), (c) runoff (mm d-1), and (d) soil moisture (%).
Figure 6. Simulated and observed annual cycle of (a) temperature (°C), (b) relative humidity (mm d-1), (c) shortwave radiation, and (d) longwave radiation.
Figure 7. Observed (a, c) and simulated (b, d) moisture flux (arrow) and moisture flux convergence (shaded) for January–March (a, b) and July–September (c, d). The Niger River Basin is shown by a blue line.
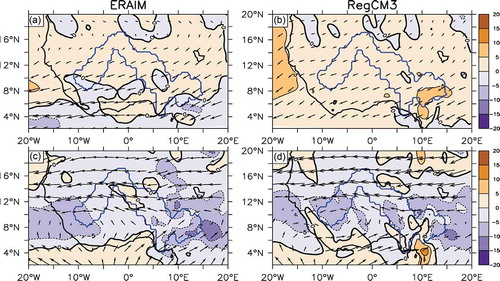
Table 2. Atmospheric water flux at the boundaries of Niger River Basin. Fin denotes flux into the basin and Fout flux out of the basin estimated from regional climate model (version 3, RegCM3) output and ERA-Interim reanalysis (ERAIM) data.
Table 3. Evaluation statistics for validating computed moisture fluxes and recycling ratios from regional climate model (RegCM3) output.
Figure 8. Simulated and observed annual cycle of (a) moisture recycling, (b) precipitation efficiency, and (c) moistening efficiency.
Table 4. Annual average of parameters for the regional precipitation cycle over the Amazon, Mississippi, Nile and Niger. Values in parentheses are computed with ERA-Interim reanalysis (ERAIM) data.