Figures & data
Figure 1. (a) The Mahurangi River catchment, and (b) the catchment’s flow–duration curve.
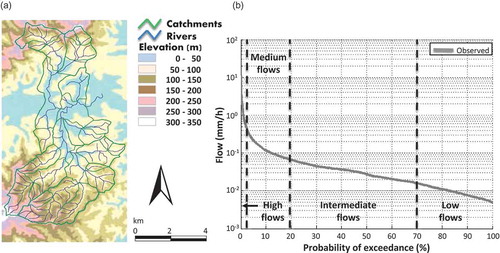
Figure 2. Probability distribution of the flow values for the Mahurangi catchment.
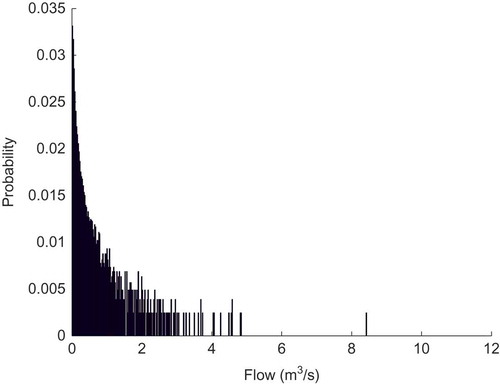
Figure 3. The log posterior probability for different numbers of bins and for different segments of the Mahurangi’s FDC.
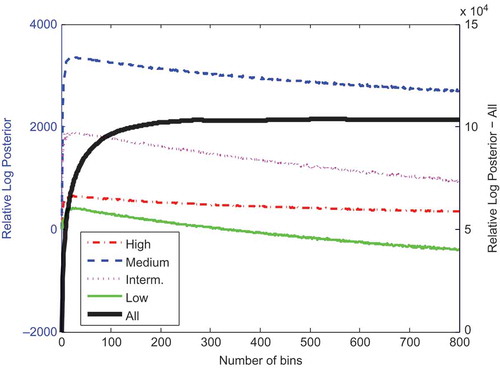
Figure 4. Flow frequency for each bin using different partition methods.
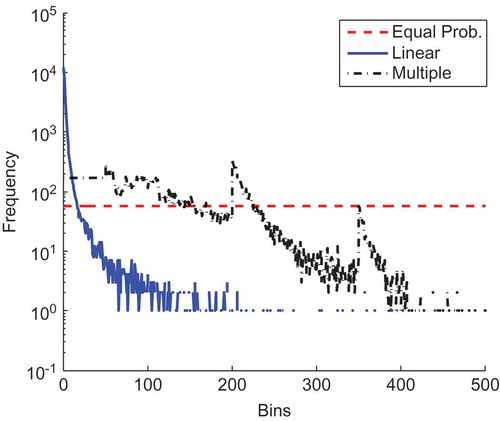
Table 1. Model performance for calibration and evaluation period using the five objective functions (NSE, and SUSE using the four binning methods). Each column presents the objective function value using the “optimum” model parameter set based on the objective function of the first column. NSE is maximised while SUSE is minimised. The diagonal bold values present the individual model performances.
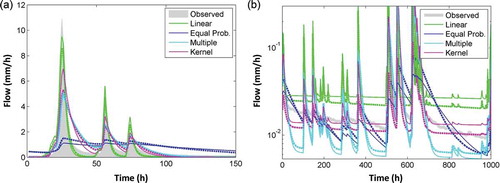
Figure 5. Simulated streamflow using the optimum model parameter set for the five measures during (a) high flow period and (b) low flow period. (c) and (d) The distribution of mean absolute error and variance using the behavioural model parameter sets (NSE > 0.7 and SUSE < 0.13) for the five measures respectively.
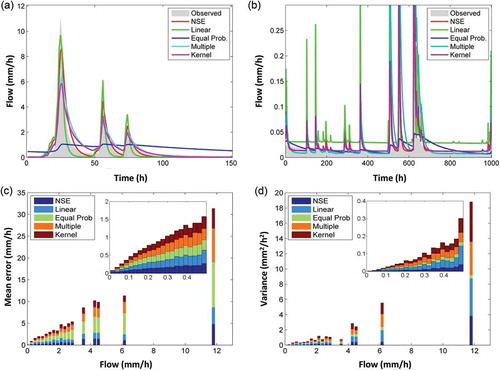
Table 2. Signature metrics for each FDC segment using the five objective functions (NSE and SUSE using the four binning methods). Results are based on the behavioural model parameter sets. The bold values present the metrics with the lowest bias for each FDC segment.
Figure 6. Frequency distribution of entropy difference metric for low, intermediate, medium and high flow values. The x-axis shows the value of the entropy difference metric and the y-axis shows the frequency of the metric values in the stated segment of the FDC.
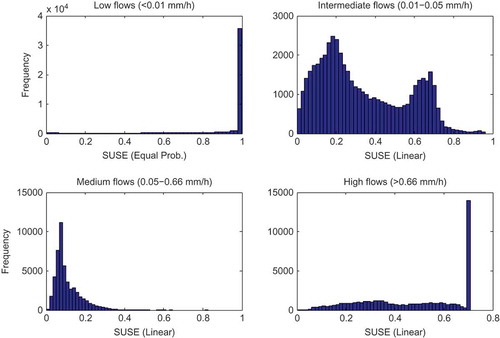
Figure 7. Simulated streamflow during (a) high flow and (b) low flow periods using the behavioural parameter sets based on the NSE and CED.
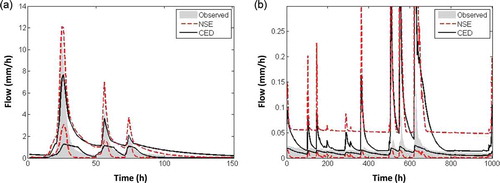
Figure 8. FDC using the CED-based model parameter sets for various threshold values.
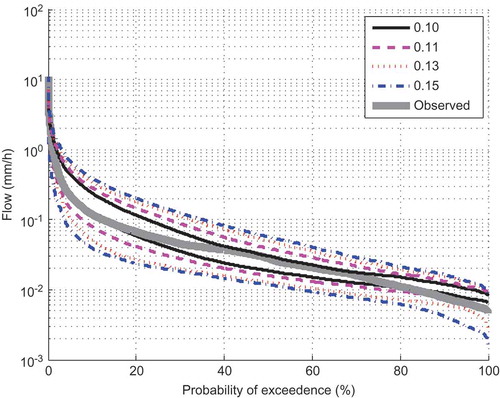
Figure 9. Simulated streamflow during (a) high flow and (b) low flow periods using the behavioural parameter sets based on the NSE and CED.
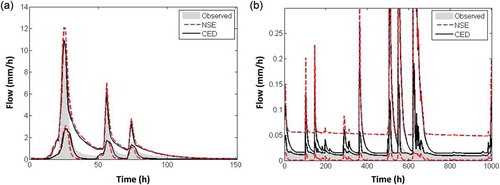
Figure 10. Probability distribution at the different segments of the FDC using the behavioural parameter sets based on the NSE and CED.
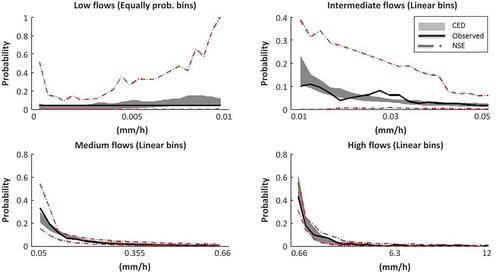
Figure C1. Simulated streamflow using the optimum model parameter set for the relative entropy measures (SUSRE; dashed lines) and SUSE measures (thin solid lines) during (a) high flow and (b) low flow periods.