
Figures & data
Figure 1. Flowchart of input selection method.
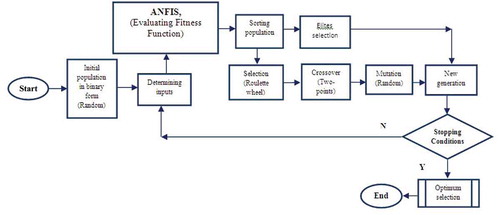
Figure 2. Lighvan and Ajichai sub-basins in the Urmia Lake basin, Iran.
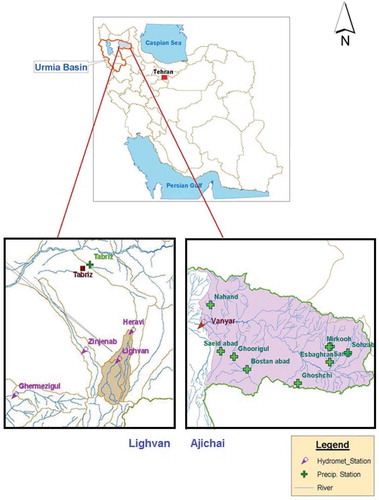
Table 1. Forecasting accuracy criteria.
Table 2. The values of key parameters.
Table 3. Comparison of model performance during test period.
Figure 3. Comparison of the basic and GA based FCM-ANFIS model output for test period—Lighvan.
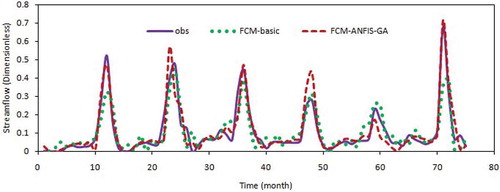
Figure 4. Comparison of the basic and GA based Sub-ANFIS model output for test period—Ajichai.
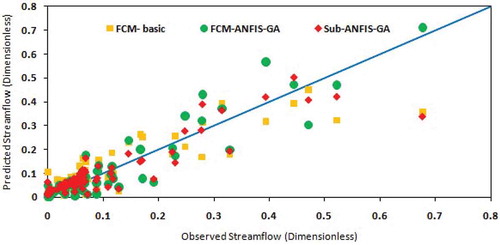
Figure 5. Comparison of scatter plots of different ANFIS models for test period—Lighvan.
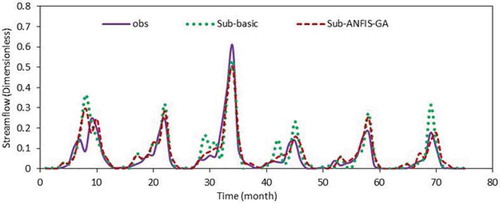
Figure 6. Comparison of scatter plots of different ANFIS models for test period—Ajichai.
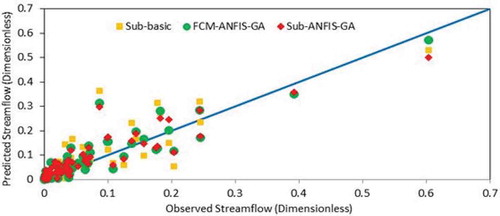
Table 4. Available data in Ajichai and Lighvan basins and optimal selection by GA*.
Table 5. Tuning of FCM-ANFIS-GA model for Lighvan.
Table 6. Tuning of Sub-ANFIS-GA model for Lighvan.
Figure 7. Mother wavelets: (a) Haar, (b) db4, (c) sym2, (d) sym3, (e) coif1.
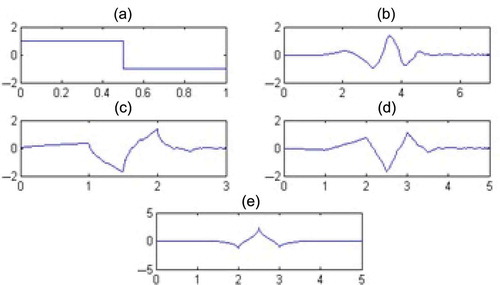
Figure 8. Comparison of NSE values for different mother wavelets and decomposition levels using Sub-WANFIS for test period of Lighvan data.
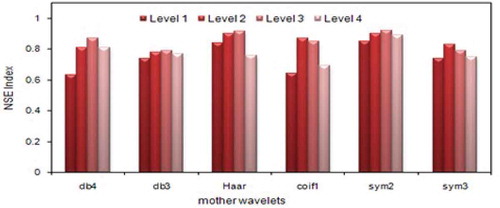
Table 7. Comparison of Sub-WANFIS models.
Figure 9. Comparison of Sub-ANFIS model output for the test period—Ajichai.
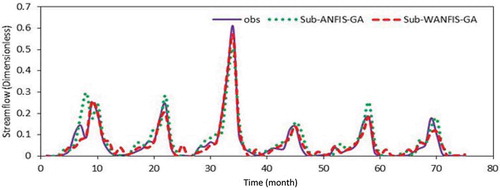
Figure 10. Comparison of scatter plots of Sub-ANFIS models for the test period—Ajichai.
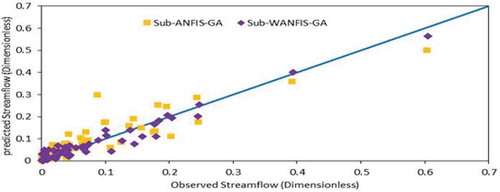
Figure 11. Comparison of NSE values for different mother wavelets and decomposition levels using FCM-WANFIS for test period of Lighvan data.
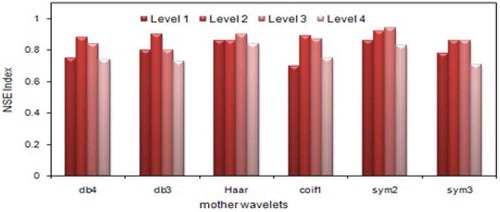
Table 8. Results of FCM-WANFIS models.
Figure 12. Comparison of FCM-ANFIS models output for the test period—Lighvan.
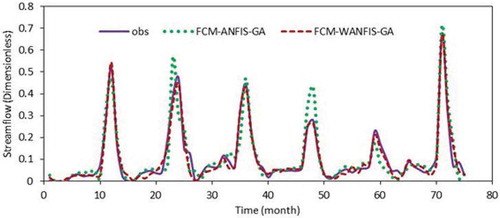
Figure 13. Comparison of scatter plots for FCM-ANFIS models for the test period—Lighvan.
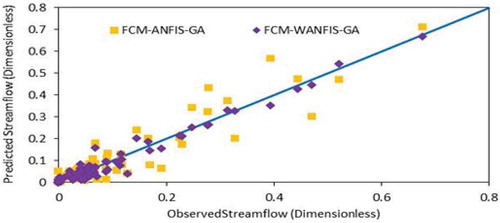
Table 9. Summary of comparison of models during test period.