Figures & data
Figure 1. Map showing the Uppar Odai sub-basin located in the western margin of Tamil Nadu State in southern India, with locations of vertical electrical soundings (VES), PWD observation wells and borewells.
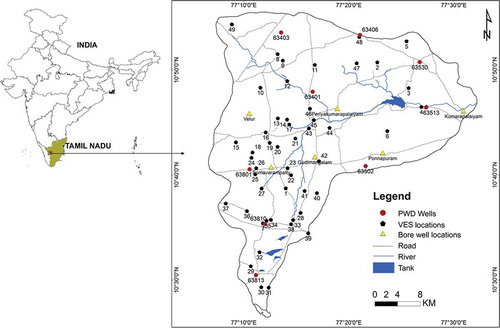
Figure 2. Geology of the Uppar Odai sub-basin, mostly covered by Precambrian crystalline rocks. The map also shows sections of geo-electrical resistivity profiles (AB: NNE–SSW, CD: NE–SW and EF: NW–SE).
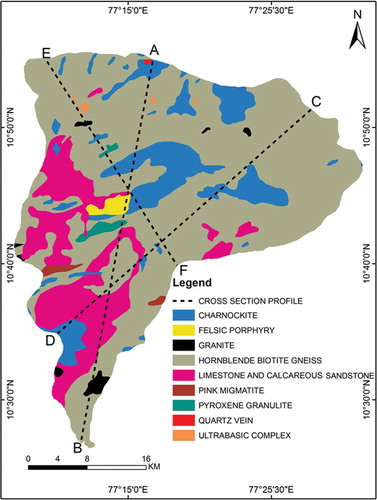
Figure 3. Flow chart showing the methodology adopted in the study.
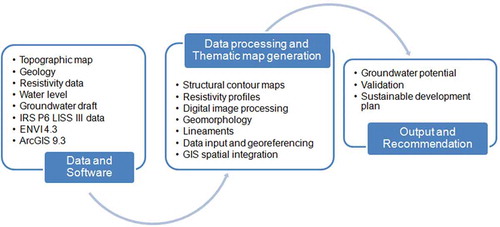
Figure 4. Structure contour for depth configurations of 25, 50, 75 and 100 m b.g.l. derived from electrical resistivity data.
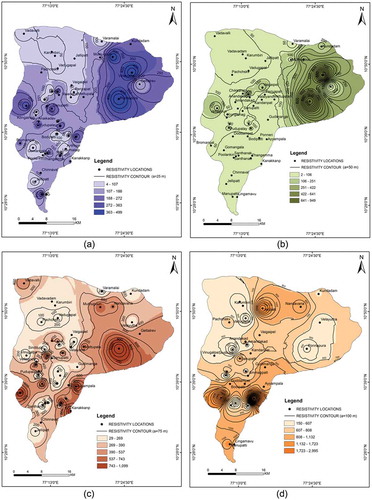
Figure 5. Resistivity profile and borewell litholog along (a) AB, (b) CD and (c) EF sections.
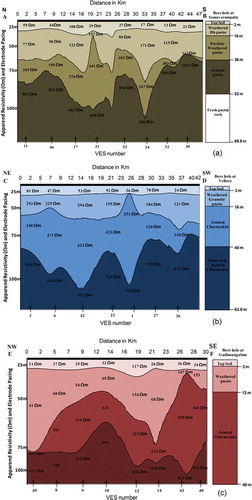
Table 1. Thematic layers, subsurface geology and associated groundwater prospects.
Figure 6. Geomorphology of Uppar Odai sub-basin interpreted from IRS P6 LISS III satellite data.
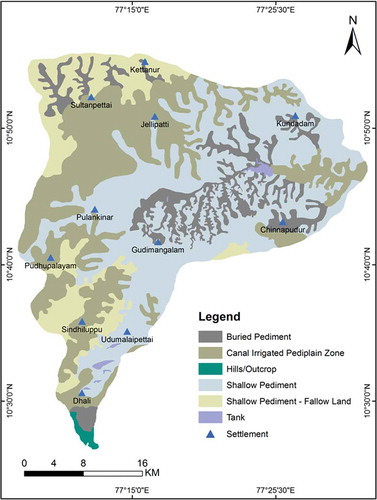
Figure 7. Lineament density map generated with the help of IRS P6 LISS III satellite data for Uppar Odai sub-basin.
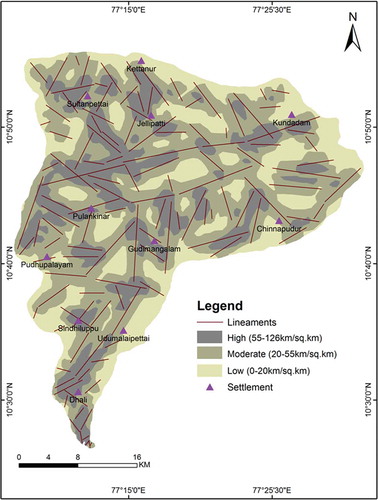
Figure 8. Layer stacking of low resistivity zones for different depth configurations (25, 50 and 75 m) and integrated groundwater potential zones for Uppar Odai sub-basin.
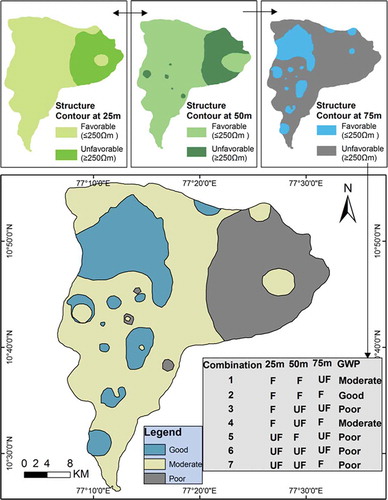
Table 2. Ranking and weight assignments of thematic layers for GIS spatial integration.
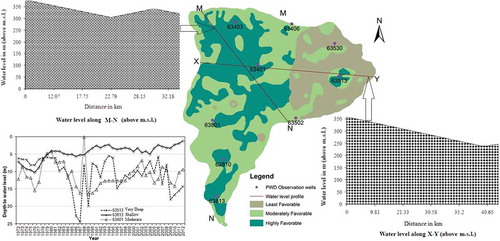
Figure 9. Integrated groundwater potential mapping derived from weighted index overlay of resistivity, geomorphology and lineament density maps. The scores were obtained (shown in legend) through the spatially integrated value of ranking and weight assigned to the themes.
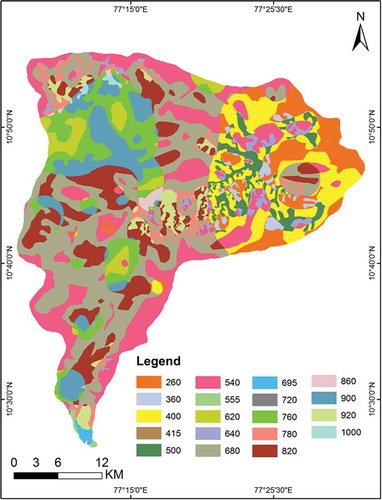
Figure 10. Sustainable groundwater potential zones in Uppar Odai sub-basin.
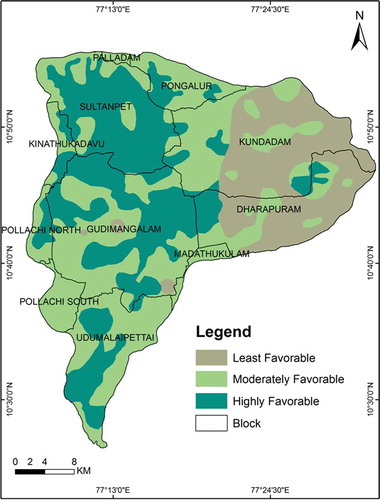
Table 3. Observation wells with average water level in the sub-basin.
Table 4. Sustainable plan for groundwater potential zones in Uppar Odai sub-basin.
Figure 11. Model validation of groundwater potential zones through water level profile for different sections in the sub-basin. MN and XY respectively indicate the NW–SE and E–W directions.