Figures & data
Table 1. Basic properties of gauging stations with at least 3 years of continuous SSC measurements.
Figure 1. Locations of gauging stations where SSC measurements were performed on a DEM of Slovenia. Number of measuring years is given in parentheses.
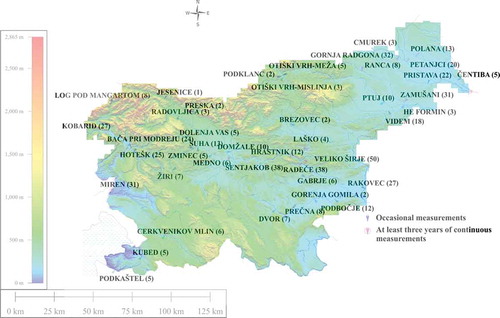
Table 2. Mann-Kendall test results with the corresponding significance levels for the annual maximum (AM) and POT1 selection of Q and SSC samples for stations with at least 3 years of continuous SSC measurements.
Figure 2. The SSC and Q trends for the Radeče station for two different periods and for two samples.
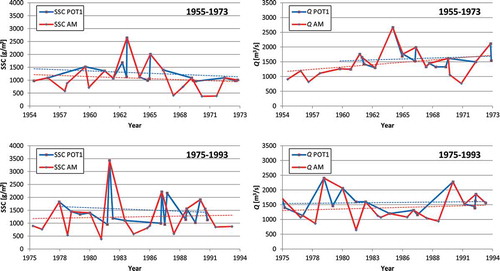
Figure 3. Annual suspended sediment loads for all stations with at least 3 years of continuous daily SSC measurements.
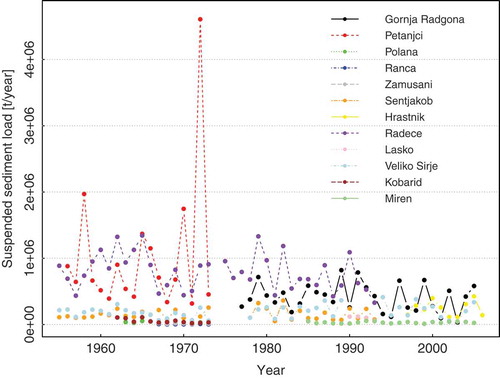
Table 3. Selected samples (AM or POT) and the chosen best fit distribution functions for gauging stations in Slovenia with at least 3 years of continuous SSC measurements.
Table 4. Flood frequency analysis results (return periods of 10 and 100 years) for the Q and SSC samples.
Table 5. Seasons with the highest and lowest values (3rd quartile) of seasonal maxima for the Q and SSC samples.
Figure 4. Seasonal maxima for the Veliko Širje station on the Savinja River for the period 1955–1973.
Figure 5. Seasonal behaviour of the suspended sediment loads for stations grouped into four major river catchments.
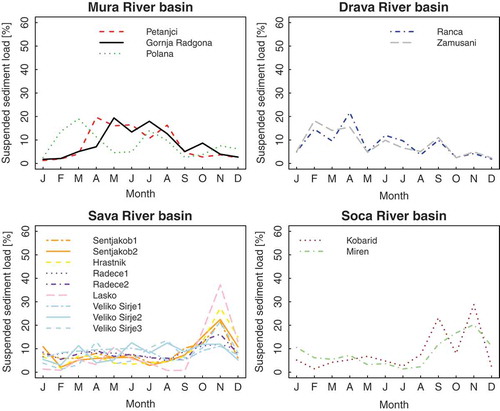
Table 6. Kendall correlation coefficients for the Q and SSC samples for at least 3 years of SSC continuous measurements.
Table 7. Maximum (QMAX and SSCMAX) and corresponding (SSCCOR and QCOR) values and dates in the observed period for the selected stations.
Figure 6. Average lag values between peak Q values defined as the POT5 sample and the corresponding maximum values of SSC.
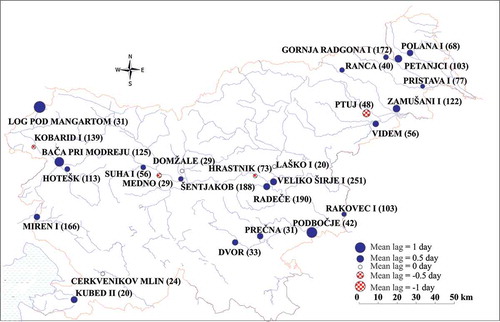
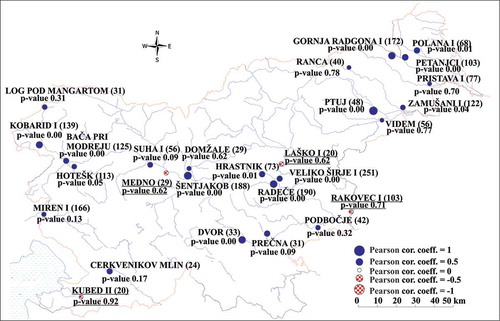
Figure 7. Pearson correlation coefficient values between peak Q and the corresponding maximum values of SSC.