
Figures & data
Figure 1. Location map of the studied area showing geological outcrops, field cross-sections, seismic lines and correlation wells.
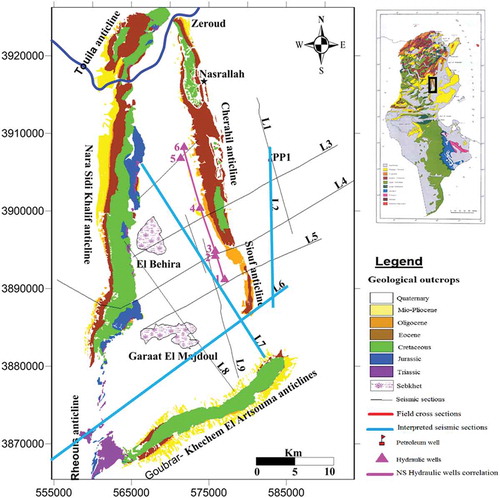
Figure 2. Seismic section (L2) calibrated to the PP1 petroleum well showing Oligocene faulted horizon extension and thickness variations according the basin structuring in subsiding synclines and resistant anticlines.
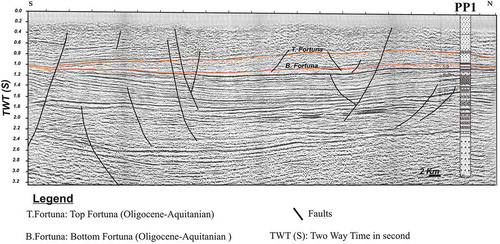
Table 1. Characterization of the Oligocene aquifers (well positions are given in ).
Figure 3. N–S Oligocene lithostratigraphic and aquifer correlation of hydraulic deep wells along western flank of Cherahil and Siouf anticlines.
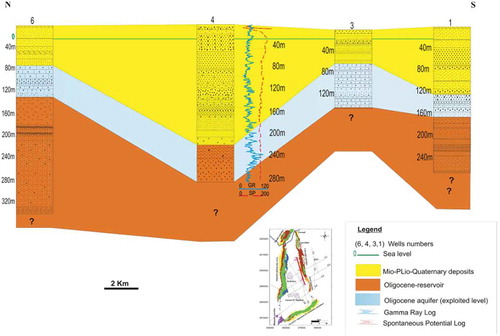
Figure 4. Lithostratigraphic column of Oligocene Fortuna Formation reservoir levels in the north of Cherahil anticline (position shown on ).
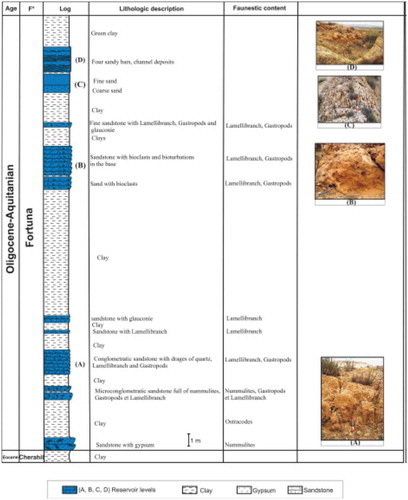
Figure 5. Lithostratigraphic column of Oligocene Fortuna Formation reservoir levels in the south of Cherahil anticline (Kodia Lhamra).
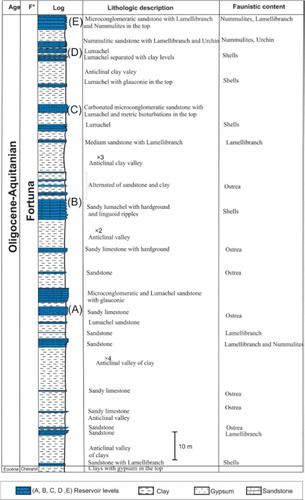
Figure 6. Seismic line (L6) interpretation showing Oligocene and Mio-Plio-Quaternary horizon structure and subsurface to surface faults, subsiding syncline and high anticline basin relationship of Sebkhet El Majdoul (position shown on ).
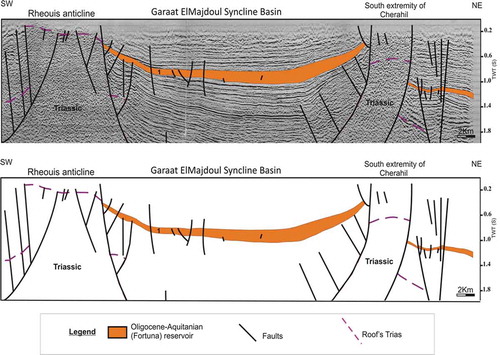
Figure 7. Seismic line (L7) interpretation showing Oligocene and Mio-Plio-Quaternary horizon structuring and subsurface to surface faults, subsiding syncline and high anticline basin relationship of Sebkhet El Majdoul (position shown on ).
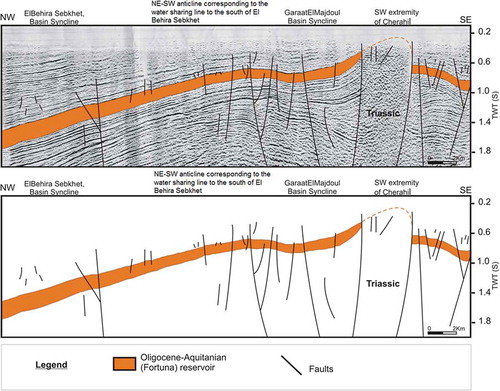
Figure 8. Isochrone map of the top Oligocene horizon in two-way time in milliseconds (with respect to DP = 400 m a.s.l.).
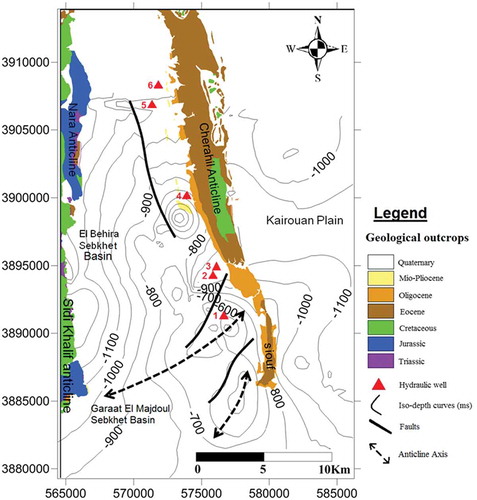
Figure 9. Depth map of the top Oligocene horizon (in m) (with respect to the topography).
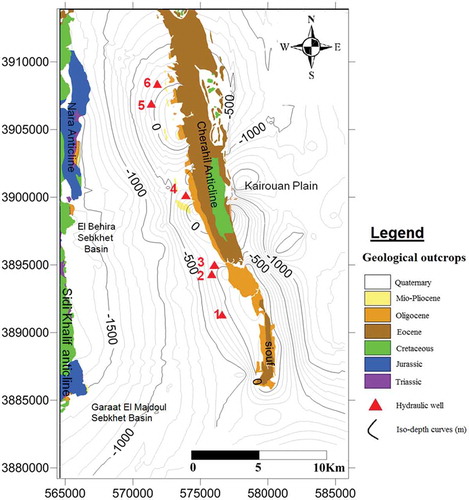
Table 2. Comparison of hydrological and seismic data.
Figure 10. Isopach map of Fortuna Formation (in m).
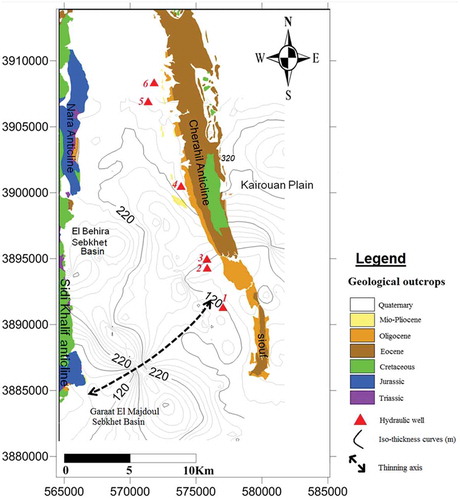
Figure 11. Three-dimensional representation of top Oligocene reservoir showing the presence of three sub-basins (1, 2 and 3).
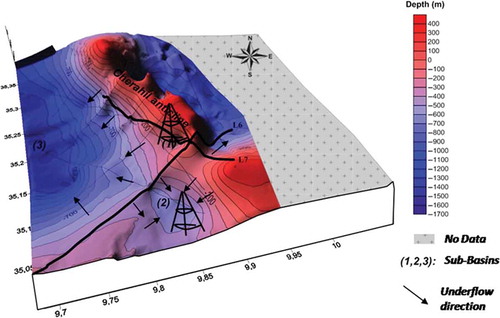
Figure 12. Piezometric map of the Mio-Plio-Quaternary aquifers in Sebkhet El Behira–Garaat El Majdoul showing underflow pathways and highlighted water lines (modified from Mansouri Citation1980).
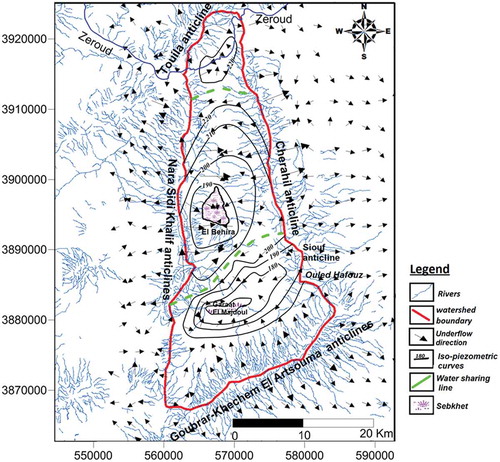
Figure 13. Digital elevation model and piezometric map of the Mio-Plio-Quaternary aquifers in Sebkhet El Behira–Garaat El Majdoul.
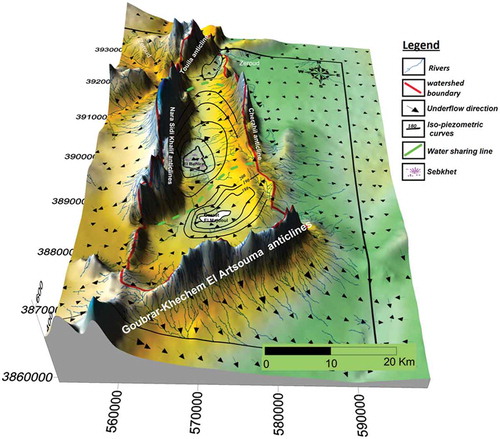
Table 3. Chemical composition of the Oligocene aquifer.