Figures & data
Figure 1. Schematic illustration of overlapping two quantile-isolines and deriving the envelope.
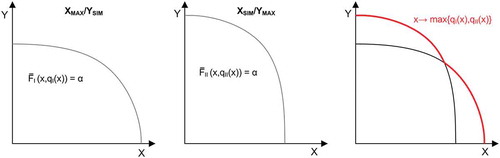
Figure 2. Schematic illustration of hydraulic interactions at a river confluence with possible structure locations and the required statistical methods within the influence reach.
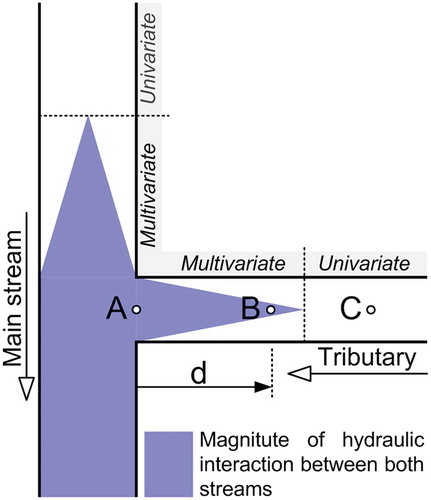
Table 1. Discharge characteristics of gauge Bonn (Rhine River) and gauge Menden (Sieg River).
Figure 3. Catchments of the Rhine River and the Sieg River (left) and the confluence reach (right).
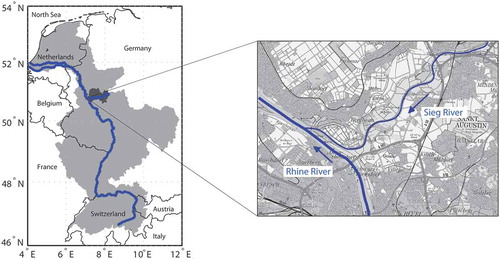
Figure 4. Annual maximum discharge series of the Rhine River at gauge Bonn (upper panel), the Sieg River at gauge Menden (middle panel) and the time difference of the occurrence of both AMAX values (lower panel).
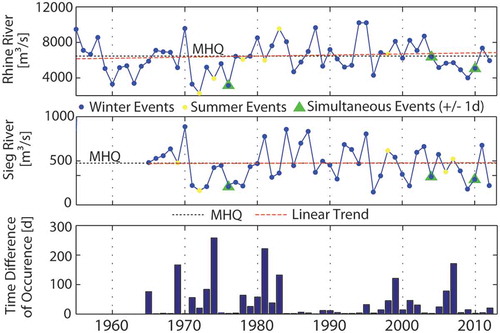
Figure 5. Marginal distributions with 95% confidence bounds fitted to the AMAX discharge series on the main stream (upper left), the simultaneous discharge series at the tributary (lower right), the AMAX discharge series at the tributary (upper right) and the corresponding simultaneous discharges at the main stream (lower left).
Table 2. Results of the goodness-of-fit test for the three considered datasets.
Figure 6. Results of the bivariate statistic for the data pairs MMAX-TSIM (upper left), MSIM-TMAX (upper right), and the theoretical MMAX-TMAX (lower left).
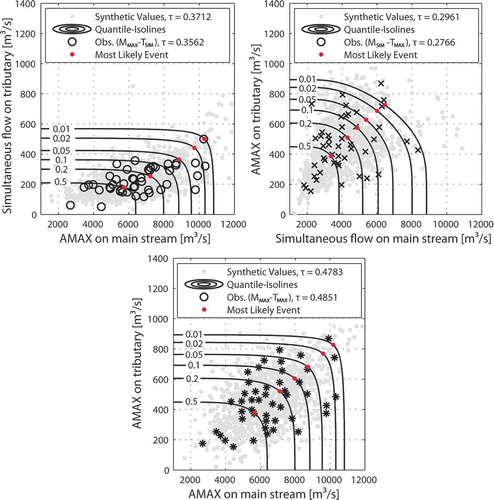
Figure 7. Overlapped quantile-isolines with annual exceedence probability of p = 0.01 derived from the two bivariate copulas fitted to the MMAX-TSIM and MSIM-TMAX datasets.
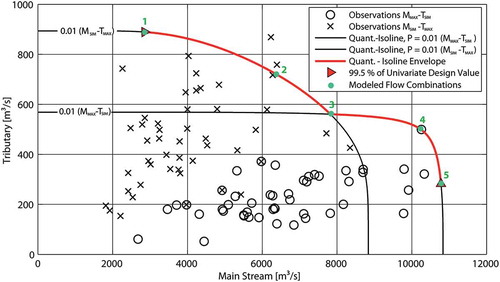
Table 3. Discharge combinations of the Rhine River and the Sieg River as input for the two dimensional hydrodynamic flow model.
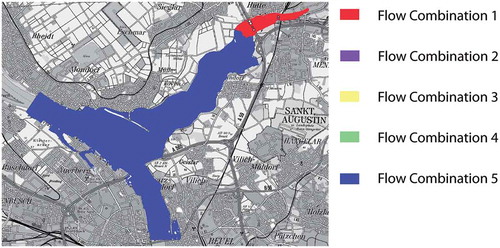
Figure 8. Results of the hydrodynamic flow model considering the five discharge combinations outlined in .
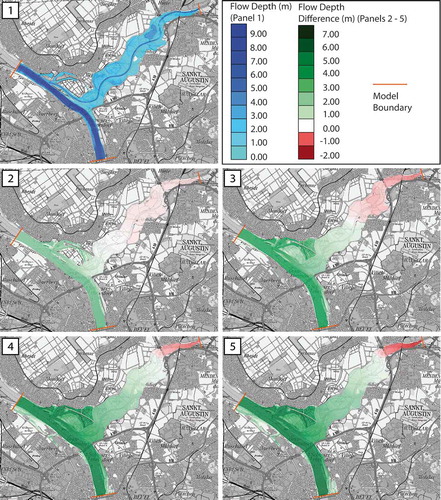
Figure 9. Design relevant discharge combinations as outlined in for the confluence reach of the Rhine River and the Sieg River.