Figures & data
Table 1. Parameters and their associated physical processes for the STNS model.
Figure 1. Map of Peninsular Malaysia showing stations used in the study.
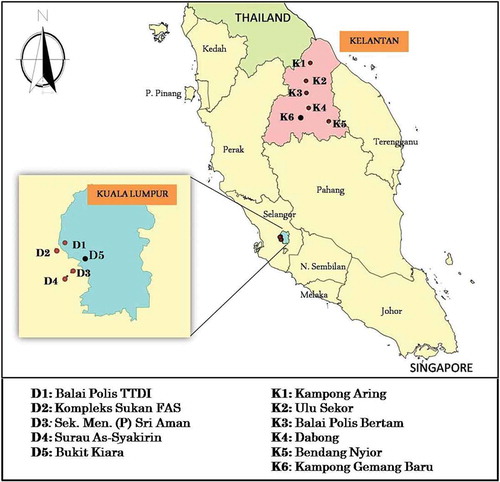
Table 2. Estimated parameters of the STNS model for the Damansara River basin.
Table 3. Estimated parameters of the STNS model for the Kelantan River basin.
Figure 2. Comparison between simulated hourly series (box plots) of STNS model and observed data (line graph) for the Damansara River basin.
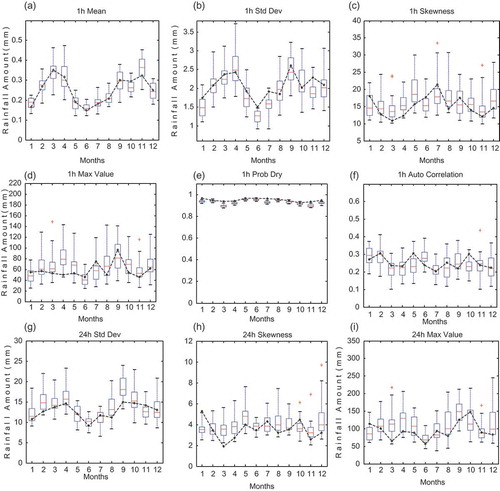
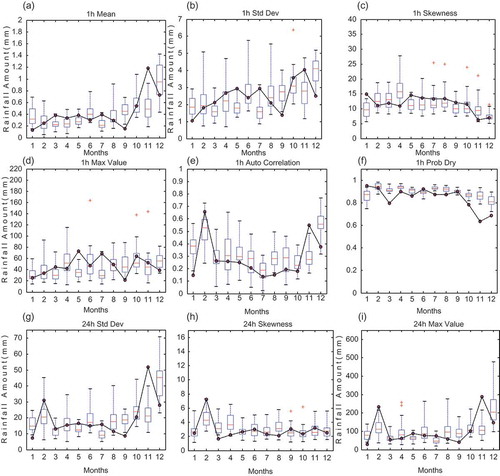
Figure 3. Comparison between simulated hourly series (box plots) of STNS model and observed data (dotted line) for the Kelantan River basin.
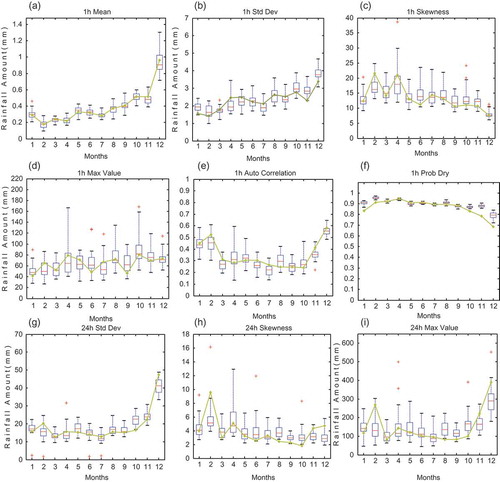
Table 4. Cumulative fraction of total variance for each parameter for the Damansara River basin.
Figure 4. Cumulative fraction of total variance explained by each harmonic for in the Damansara River basin.
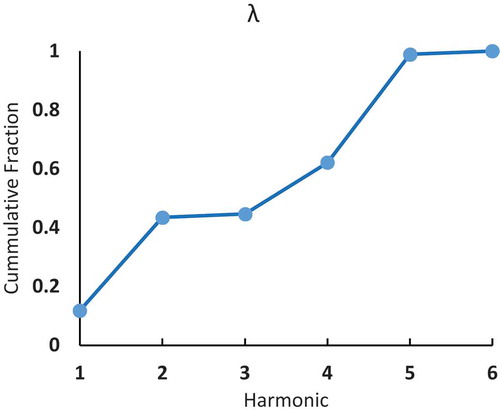
Table 5. Fourier coefficients for each parameter of the STNS (Fo) model for the Damansara River basin.
Figure 5. Comparison between simulated hourly series (box plots) of STNS (Fo) model and observed data (dotted lines) for the Damansara River basin.
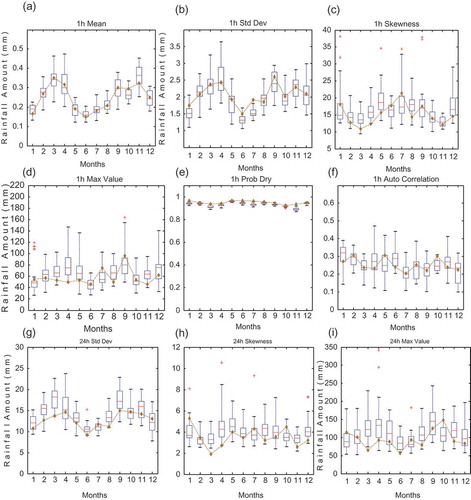
Table 6. Cumulative fraction of total variance for the parameters for the Kelantan River basin.
Table 7. Fourier coefficients for parameters of the STNS (Fo) model for the Kelantan River basin.
Figure 6. Comparison between simulated hourly series (box plots) of STNS (Fo) model and observed data (line graph) for the Kelantan River basin.
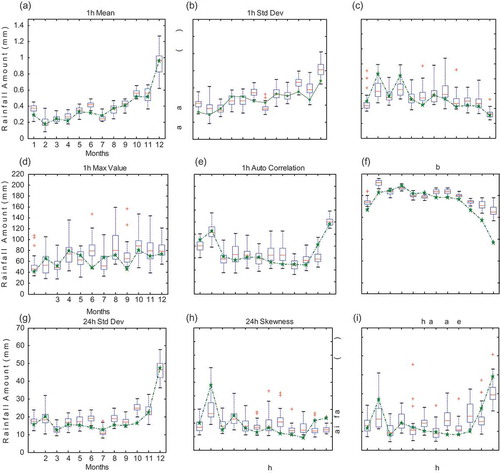
Table 8. The RMSE for the STNS models for the Damansara River basin.
Table 9. The RMSE for the STNS models for the Kelantan River basin.
Figure 7. Comparison between simulated hourly series (box plots) of STNS (Fo) model and observed data (dotted line) for the Damansara River basin for validation period.
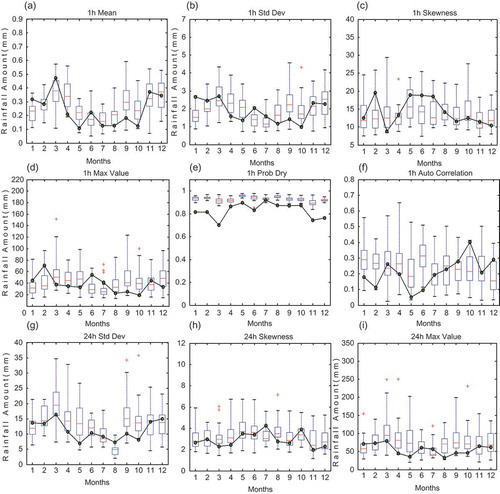
Figure 8. Comparison between simulated hourly series (box plots) of STNS (Fo) model and observed data (line graph) for the Kelantan River basin for validation period.