
Figures & data
Figure 1. (a). Geographic location of the study area and the location of Birmingham weather station used for the study, (b) Longitudinal bottom elevation along the centerline of BRRS and water surface elevation after a large release from the Smith Dam tailrace to Bankhead Lock & Dam, (c) Color contours of the bottom elevation showing Sipsey Fork, the lower Mulberry Fork, and Black Warrior River as the model simulation domain; two monitoring stations (Cordova and GOUS), model upstream and downstream boundary locations: Smith Dam tailrace (SDT) and Bankhead L&D (BLD), three locations for reporting simulation results (MSF, UPJ and MJC, ).

Table 1. Statistical summary of the intermittent flow releases from Smith Dam.
Table 2. Description and abbreviation of cross-sectional locations used in the study ().
Figure 2. Time-series plots of (a) upstream unsteady flow releases at SDT, (b) upstream temperature boundary conditions at SDT and (c) downstream water surface elevation (m) at BLD in 2011.
Figure 3. Time-series plot of observed and modeled water surface elevations (m) at the monitoring station Cordova from 4 May to 3 September 2011.
Figure 4. Time-series plots of observed and modeled (a) surface water temperature (°C) at the Cordova monitoring station and (b) bottom temperature at GOUS ( and ).
Figure 5. Time-series plots of observed and modeled average velocity and total discharge at the cross-section of Cordova.
Table 3. Statistics for model performance evaluation on water surface elevation (m) and water temperature (°C) simulations at the Cordova and GOUS monitoring stations.
Table 4. Calculated averages and ranges of flow rates and total volumes of water in the bottom layer at MSF, Cordova and GOUS from 1–5 June, 2011.
Figure 6. Time-series of (a) modeled cross-sectional average velocity and water depth, (b) modeled flow rates in the surface, and bottom layers at the middle of Sipsey Fork from May 31 to 4 June 2011 including the release from Smith Dam.
Figure 7. Time-series of modeled cross-sectional average velocities (m/s) at MSF, UPJ, MJC, Cordova and GOUS () after daily large releases from June 3–9.
Figure 8. Time-series of modeled flow rates (major y axis, −20–20 m3/s) in the surface and bottom layers at the Cordova and GOUS monitoring stations including the release from Smith Dam (the secondary y axis with a different scale, 0–200 m3/s) .
Figure 9. Vertical velocity profiles at the centerlines (10 layers/cells along depth) of MSF, UPJ, MJC, Cordova and GOUS at 13:15 h on June 7 (1 hr after the large release began), 22:15 h on June 7 (4 hrs after the large release stopped) and 11:45 h on June 8 (18 hrs after the large release stopped) in 2011. Zero velocity is indicated by a vertical line. Positive and negative velocities mean the flow moving downstream (from SDT to BLD) and upstream (from BLD to SDT), respectively.
Figure 10. Simulated temperature distributions (contours) along the channel centerline of BRRS from SDT to GOUS at three different times after a large release on 7 June 2011: (a) 1 hour after the large release started, (b) 4 hours after the large release stopped and (c) about 18 hours after the large release stopped.
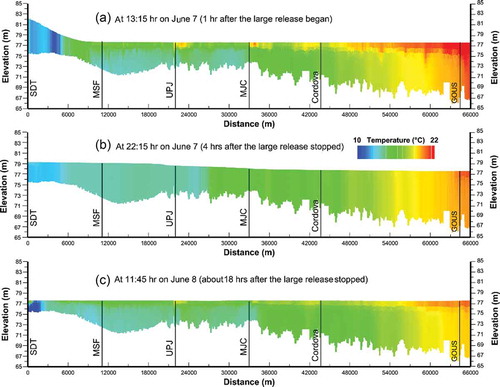
Figure 11. Time-series of modeled surface and bottom temperatures at MSF from May 31 to 4 June 2011 including air temperature at Birmingham, release flow and temperature measured at SDT.
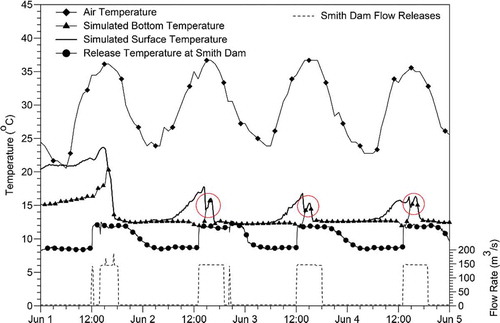
Figure 12. Time-series of modeled surface and bottom temperatures at the middle of Sipsey Fork, upstream of the junction and downstream of the junction from May 22 to 11 June 2011 including release flow and temperature measured at Smith tailrace.
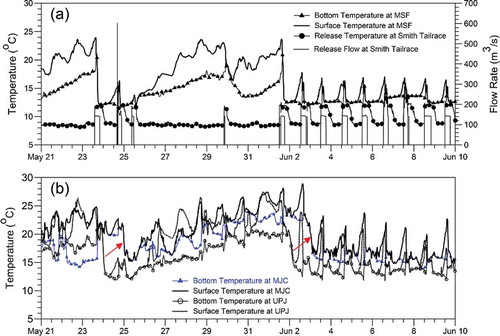
Figure 13. (a). Time-series of air temperature, modeled surface and bottom temperatures at the USGS Cordova monitoring station under actual releases and base flow only, tributary inflow, release flow (m3/s) from Smith Dam from April 11 to 28 October 2011. (b) Zoom in from May 21 to 10 June 2011 including modeled deep depth temperatures with base flow release (2.83 m3/s) from Smith Dam.
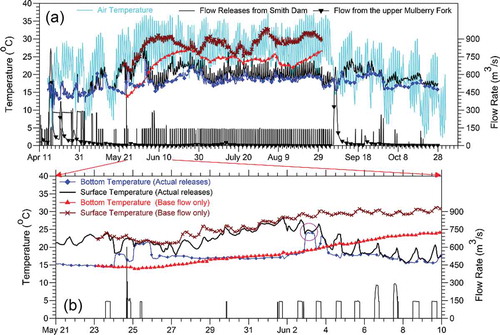
Table 5. Statistics of differences of simulated temperatures (°C) at different locations from 23 May to 30 August, 2011, between under the baseflow only and using actual releases from Smith Dam.