Figures & data
Figure 1. The Upper Niger Catchment and the Inner Niger Delta. The sub-catchments and their downstream gauging stations for which separate sub-models were developed are indicated.
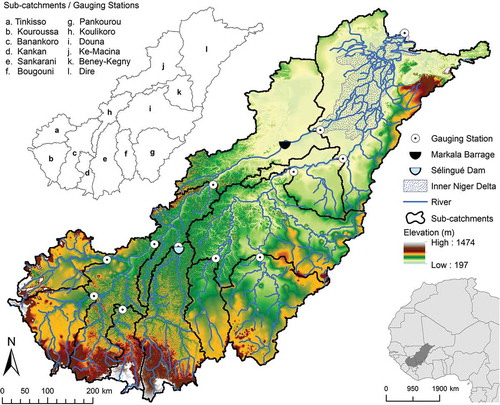
Figure 2. (a) The relationship between weighted aggregate inflow to the Inner Niger Delta (Ke-Macina + Beney-Kegny) and monthly outflow (Douna), (b) comparison between observed and calculated monthly flows at Douna. Analyses are based on the period 1953–1992 using GRDC gauging station records.
Table 1. GCMs that were pattern-scaled by ClimGen and applied in this study.
Figure 3. Monthly mean observed and simulated discharges for seven gauging stations within the Upper Niger for the period 1950–2000. The calibration (1950–1975), validation (1976–2000) and baseline (1961–1990) periods are indicated. Note different y-axis scales. Letters in brackets refer to the sub-catchments identified in .
Table 2. Model performance statistics for twelve gauging stations within the Upper Niger for the calibration (Cal. 1950–1975), baseline (BL 1961–1990) and validation (Val. 1976–2000) periods. Letters after gauging station names refer to the labels used in . Model performance indicators are taken from Henriksen et al. (Citation2008).
Figure 4a. Observed and simulated mean monthly discharges for 12 gauging stations within the Upper Niger for the period for the calibration (1950–1975), baseline (1961–1990) and validation (1976–2000) periods. Note different y-axis scales. Letters in brackets refer to the sub-catchments identified in . Symbols in square brackets indicate availability for each period: + Good, +- Medium, – Poor.
Figure 4b. Continued.
Figure 5. Flood extent within the Inner Niger Delta: (a) simulated monthly flood extent and annual maxima provided by Zwarts and Grigoras (Citation2005); (b, c, d) simulated (S) vs Zwarts and Grigoras (Citation2005) (ZG) annual maximum flood extents for the calibration, baseline and validation periods, respectively.
Table 3. Mean annual precipitation (Precip.) and potential evapotranspiration (PET) for the baseline (mm) and changes (%) for the climate change scenarios for sub-catchments within the Upper Niger catchment. (Shaded cells indicate negative changes compared to the baseline).
Figure 6. Mean monthly precipitation and PET for the baseline and the 2°C, seven GCM climate change scenarios for four representative sub-catchments within the Upper Niger. Note different y-axis scales. Letters in brackets refer to the sub-catchments identified in .
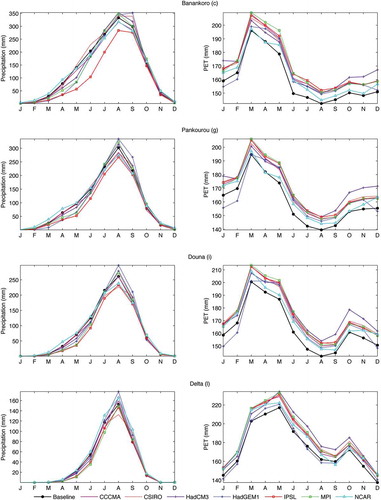
Table 4. Mean annual mean, Q5 and Q95 discharges for the baseline (m3s-1) and changes (%) for the climate change scenarios for 12 gauging stations within the Upper Niger catchment. (Shaded cells indicate negative changes compared to the baseline).
Figure 7. Simulated river regimes for the baseline and 2°C, seven GCM climate change scenarios for 12 gauging stations within the Upper Niger. Note different y-axis scales. Letters in brackets refer to the sub-catchments identified in .
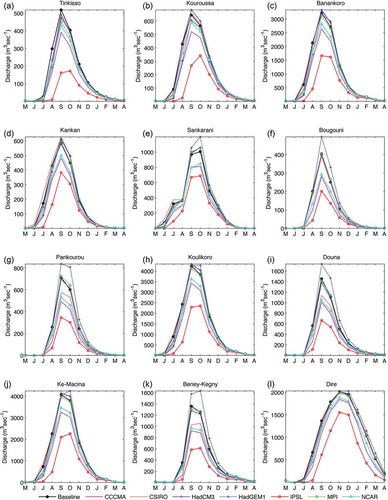
Figure 8. Baseline and 2°C, seven GCM climate change scenario river inflows to the Inner Niger Delta: (a) mean monthly inflows; (b) scenario change in mean annual inflows compared to the baseline. CC = CCCMA; CS = CSIRO; H3 = HadCM3; H1 = HadGEM1; IP = IPSL; MP = MPI; NC = NCAR.
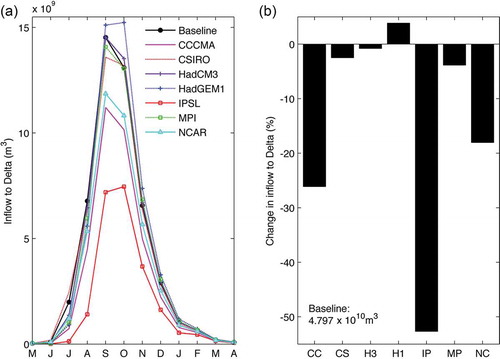
Figure 9. Flood regimes for the Inner Niger Delta for the baseline and 2°C, seven GCM climate change scenarios.
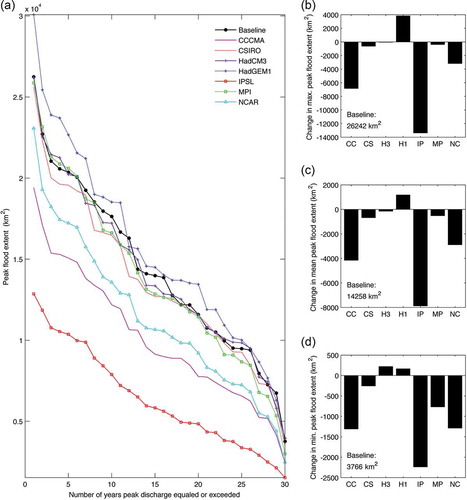
Figure 10. Impacts of the 2°C, seven GCM climate change scenarios on annual peak flood extents within the Inner Niger Delta: (a) peak flood extent-frequency for the baseline and each scenario; (b-d) change from the baseline in the maximum, mean and minimum annual peak flood extents. CC = CCCMA; CS = CSIRO; H3 = HadCM3; H1 = HadGEM1; IP = IPSL; MP = MPI; NC = NCAR.