
Figures & data
Figure 1. The proliferation of Hurst’s work in different scientific fields.
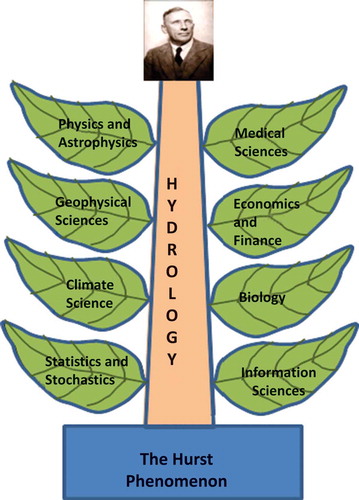
Table 1. Definitions of Population Range and Adjusted Range.
Figure 2. Globally averaged annual precipitation calculated from 5° × 5° GHCN (version 2) monthly precipitation dataset for the period 1900–2014 (http://www.ncdc.noaa.gov/temp-and-precip/ghcn-gridded-products/).
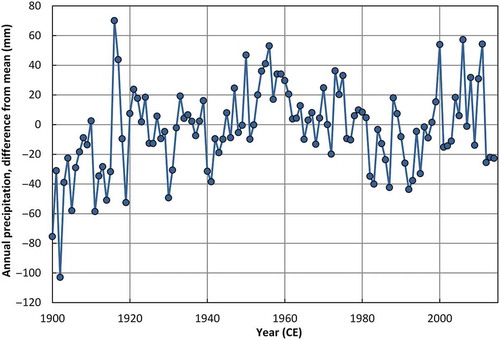
Figure 3. Number of citations per year of Hurst’s original paper (bars; adding up to 3752 citations) and papers in which one or more of the phrases “Hurst coefficient”, “Hurst exponent”, “Hurst parameter”, “Hurst effect” or “Hurst Phenomenon” appear (solid line; summing to 22 755 citations). Data from Google Scholar as of March 2014. Notice the logarithmic scale of the vertical axis.
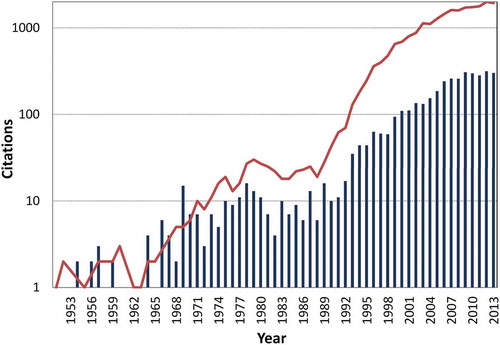
Table 2. Top-cited papers (from journals) with reference to Hurst’s work in different scientific fields (two from each one) and their impact in terms of citations (data from Google Scholar as of March 2014).