
Figures & data
Figure 1. Distribution across Iran of the synoptic meteorological stations used in this research.
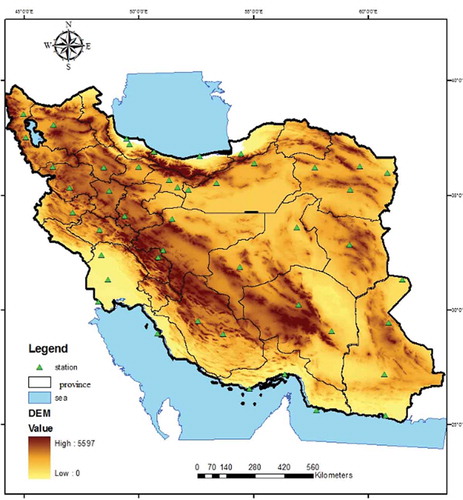
Table 1. Properties of meteorological stations used in this research.
Figure 2. Proposed methodology for study of climate change impacts on temperature, precipitation and potential evapotranspiration in this research.
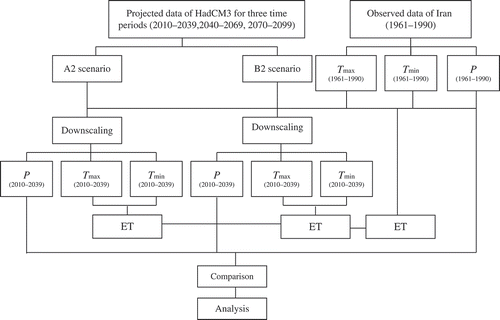
Figure 3. Maps of precipitation values in the base and future time periods under scenario A2. (a) Base period; scenario A2 for (b) 2010–2039, (c) 2040–2069, (d) 2070–2099.
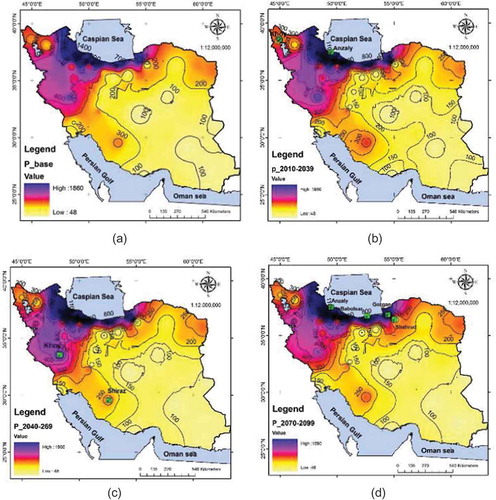
Figure 4. The values of maximum, mean, minimum and standard deviation of precipitation in the base and future time periods under scenario A2.
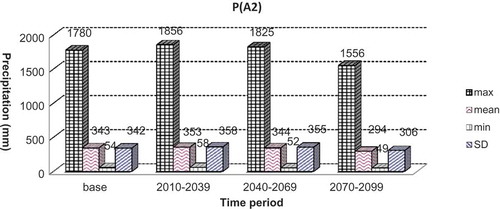
Figure 5. Maps of precipitation values in the base and future time periods under scenario B2. (a) Base period; scenario B2 for (b) 2010–2039, (c) 2040–2069, (d) 2070–2099.
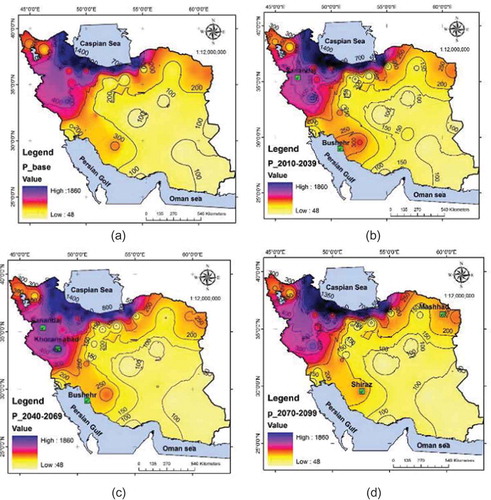
Figure 6. The values of maximum, mean, minimum and standard deviation of precipitation in the base and future time periods under scenario B2.
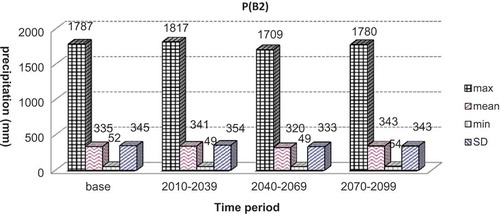
Figure 7. Maps of temperature values in the base and future time periods under scenario A2. (a) Base period; scenario A2 for (b) 2010–2039, (c) 2040–2069, (d) 2070–2099.
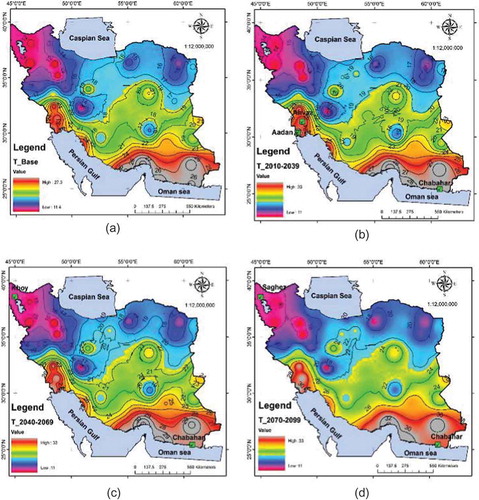
Figure 8. The values of maximum, mean, minimum and standard deviation of temperature in the base and future time periods under scenario A2.
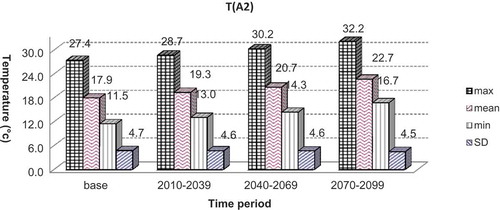
Figure 9. Maps of temperature values in the base and future time periods under scenario B2. (a) Base period; scenario B2 for (b) 2010–2039, (c) 2040–2069, (d) 2070–2099.
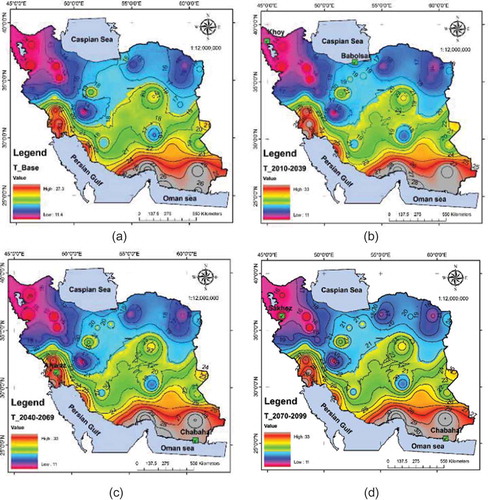
Figure 10. The values of maximum, mean, minimum and standard deviation of temperature in the base and future time periods under scenario B2.
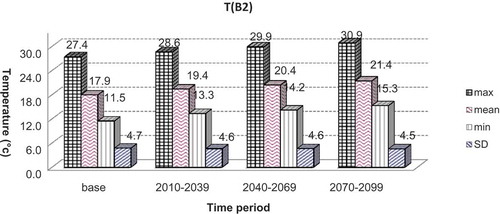
Figure 11. Maps of potential evapotranspiration values in the base and future time periods under scenario A2. (a) Base period; scenario A2 for (b) 2010–2039, (c) 2040–2069, (d) 2070–2099.
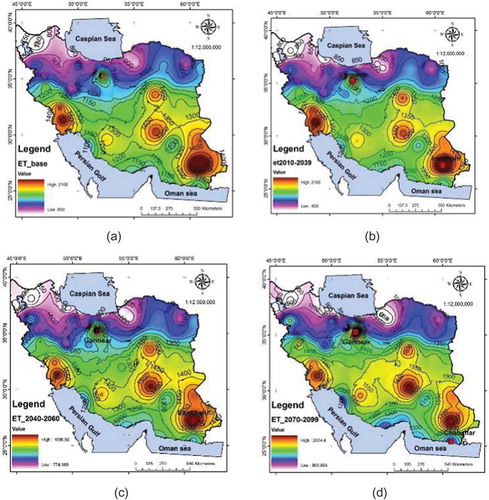
Figure 12. The values of maximum, mean, minimum and standard deviation of potential evapotranspiration in the base and future time periods under scenario A2.
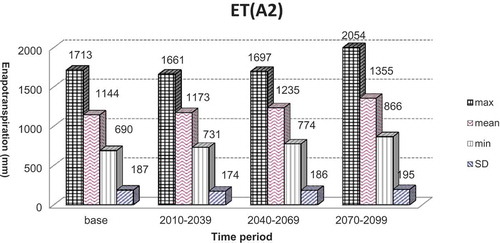
Figure 13. Maps of potential evapotranspiration values in the base and future time periods under scenario B2. (a) Base period; scenario B2 for (b) 2010–2039; (c) 2040–2069; (d) 2070–2099.
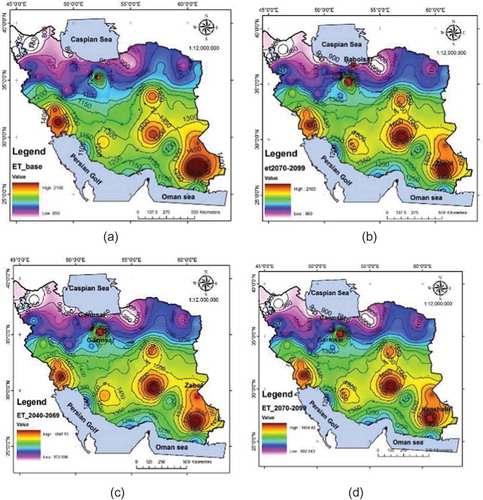
Figure 14. The values of maximum, mean, minimum and standard deviation of potential evapotranspiration in the base and future time periods under scenario B2.
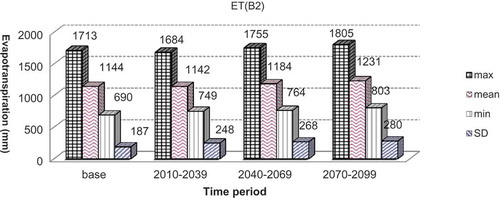
Table 2. Extreme values of P, T and ET for 2010–2039 under scenarios A2 and B2.
Table 3. Extreme values of P, T and ET for 2040–2069 under scenarios A2 and B2.
Table 4. Extreme values of P, T and ET for 2070–2099 under scenarios A2 and B2.